
Overview
Goal
See the key numbers on one page: revenue, requests, impressions, Fill Rate and how they changed against the previous period. An overview is a set of widgets that you can change: counters, charts, tables and headings.
Before you start
- Publishers with statistics. Without requests, widgets show "No statistics for the selected period".
Steps
Open Overview in the left menu. When you first open it, the dashboard creates the "Home" overview: today's summary (revenue, requests, impressions, clicks, Fill Rate, RPM), revenue by day, the top sites and the top placements by revenue. Placements are the same as Zone ID in reports.
Select the period in the top right: Today, Yesterday, Last 7 days and so on, or your own dates.
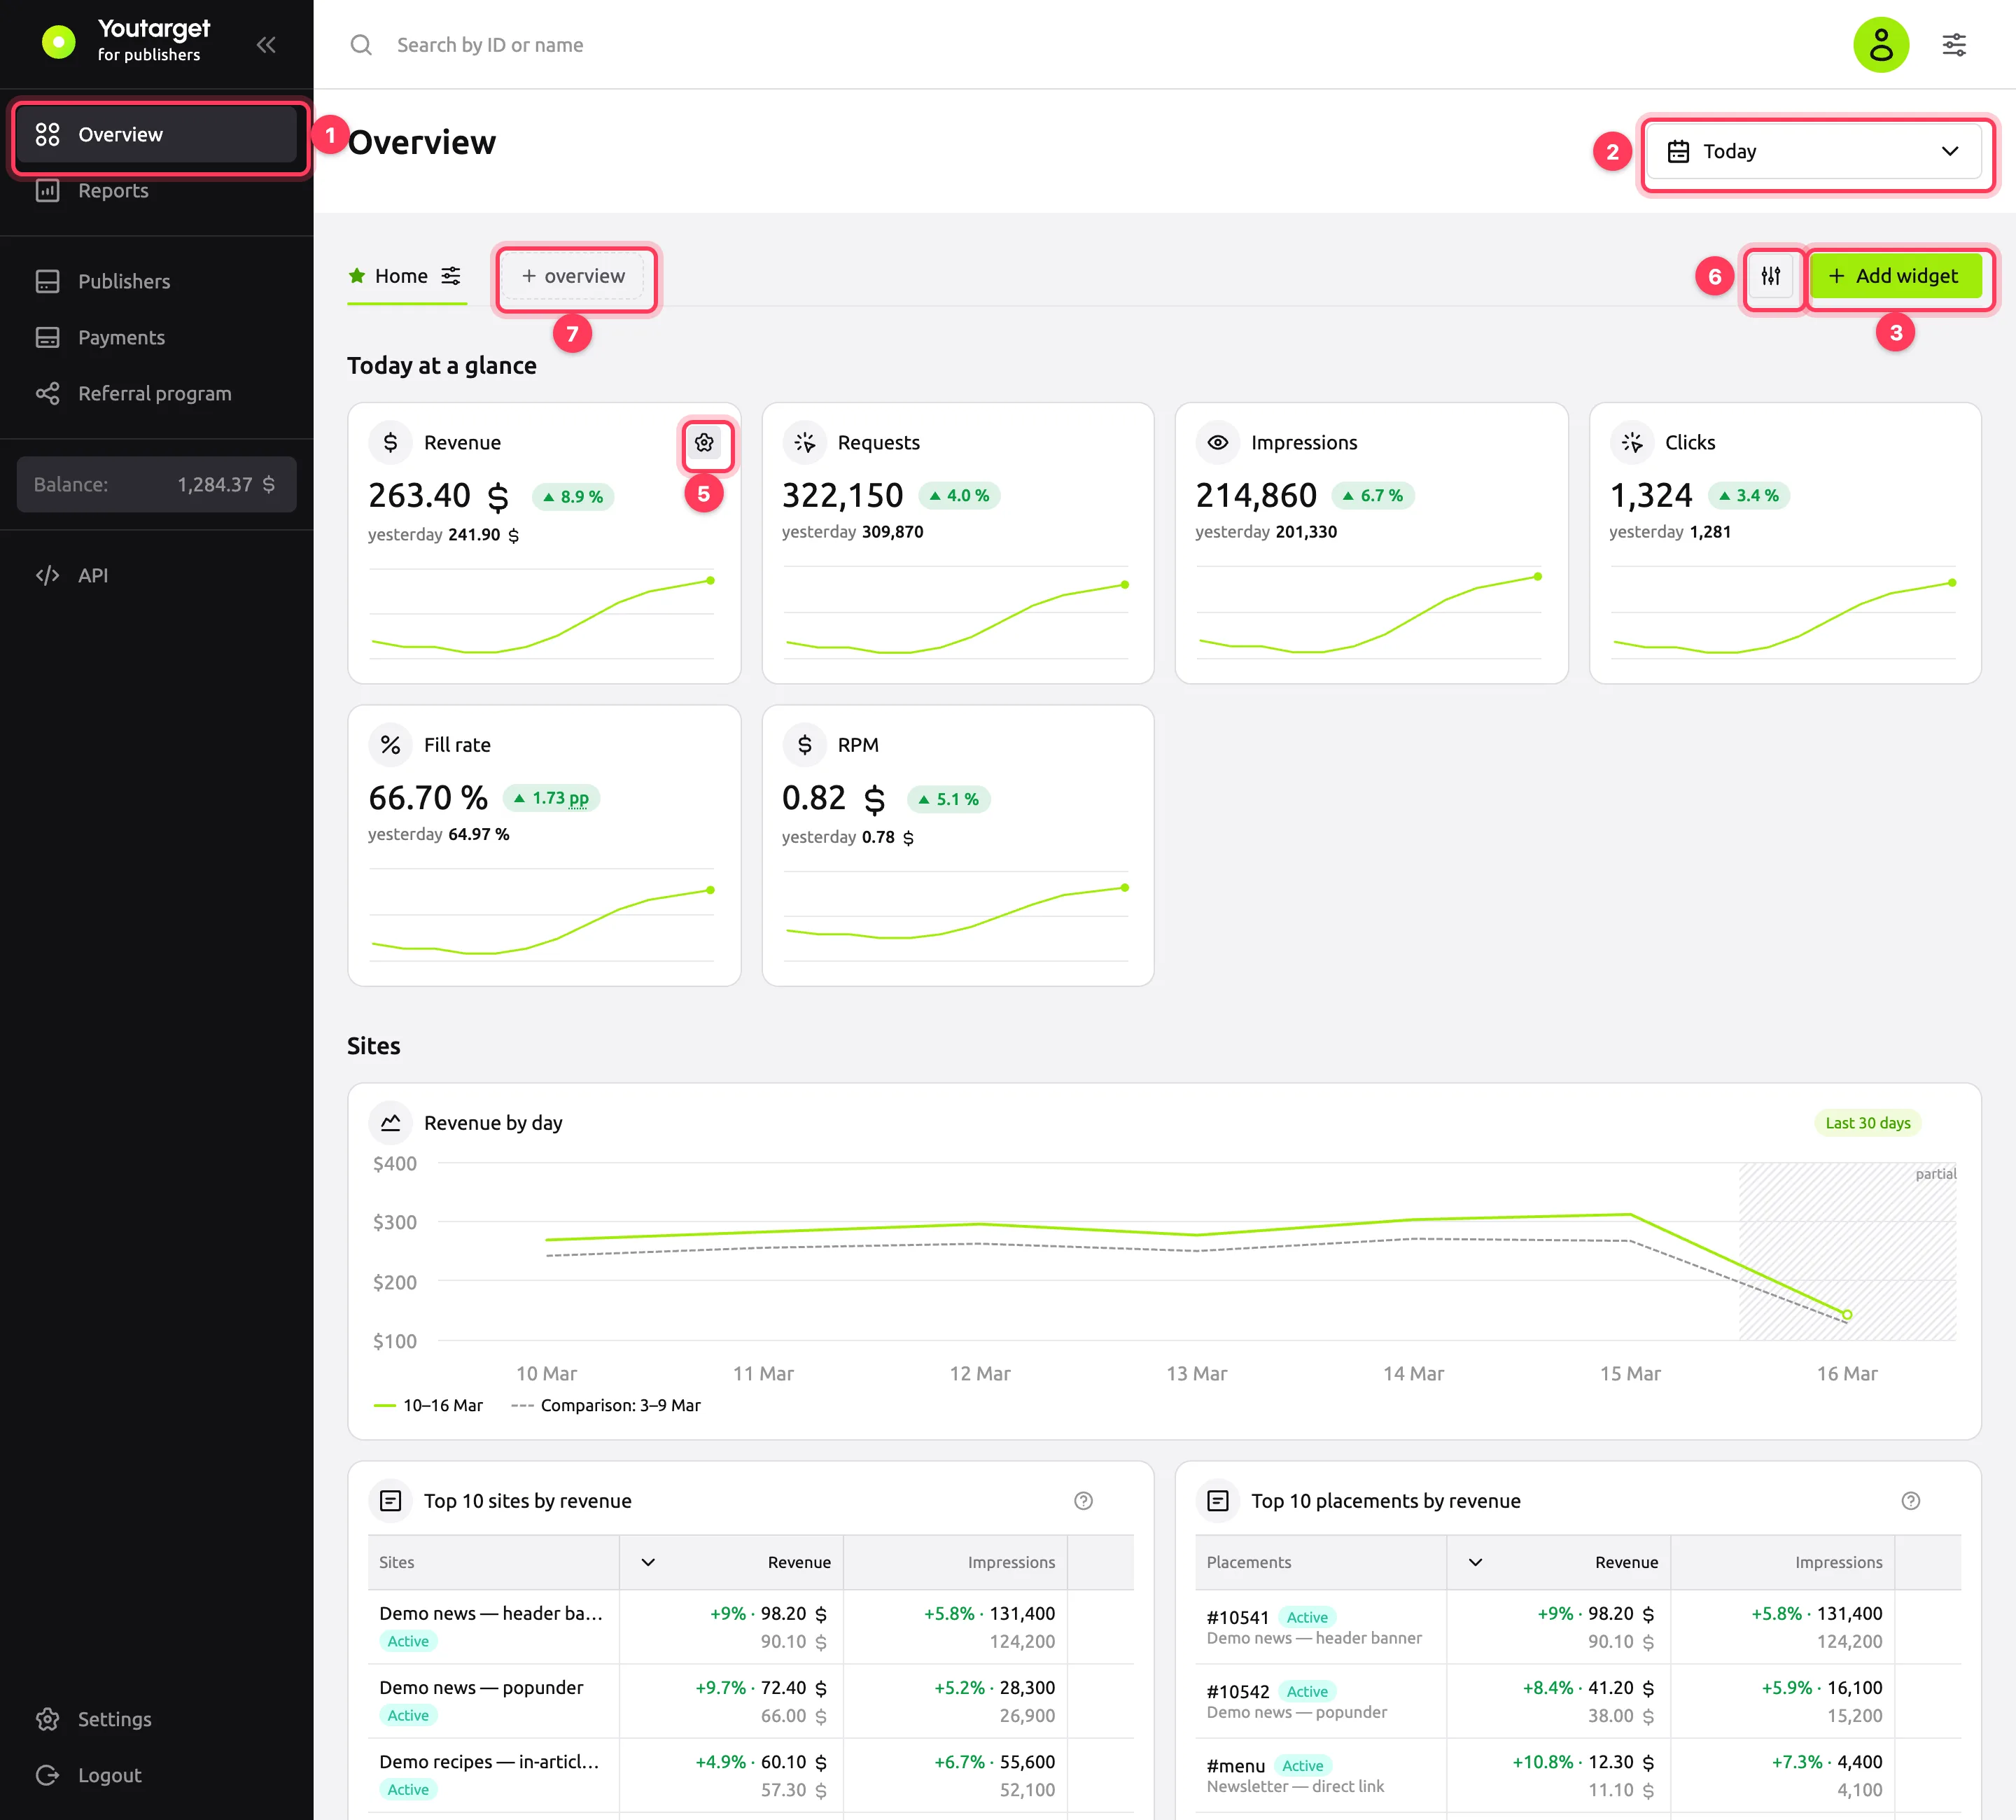
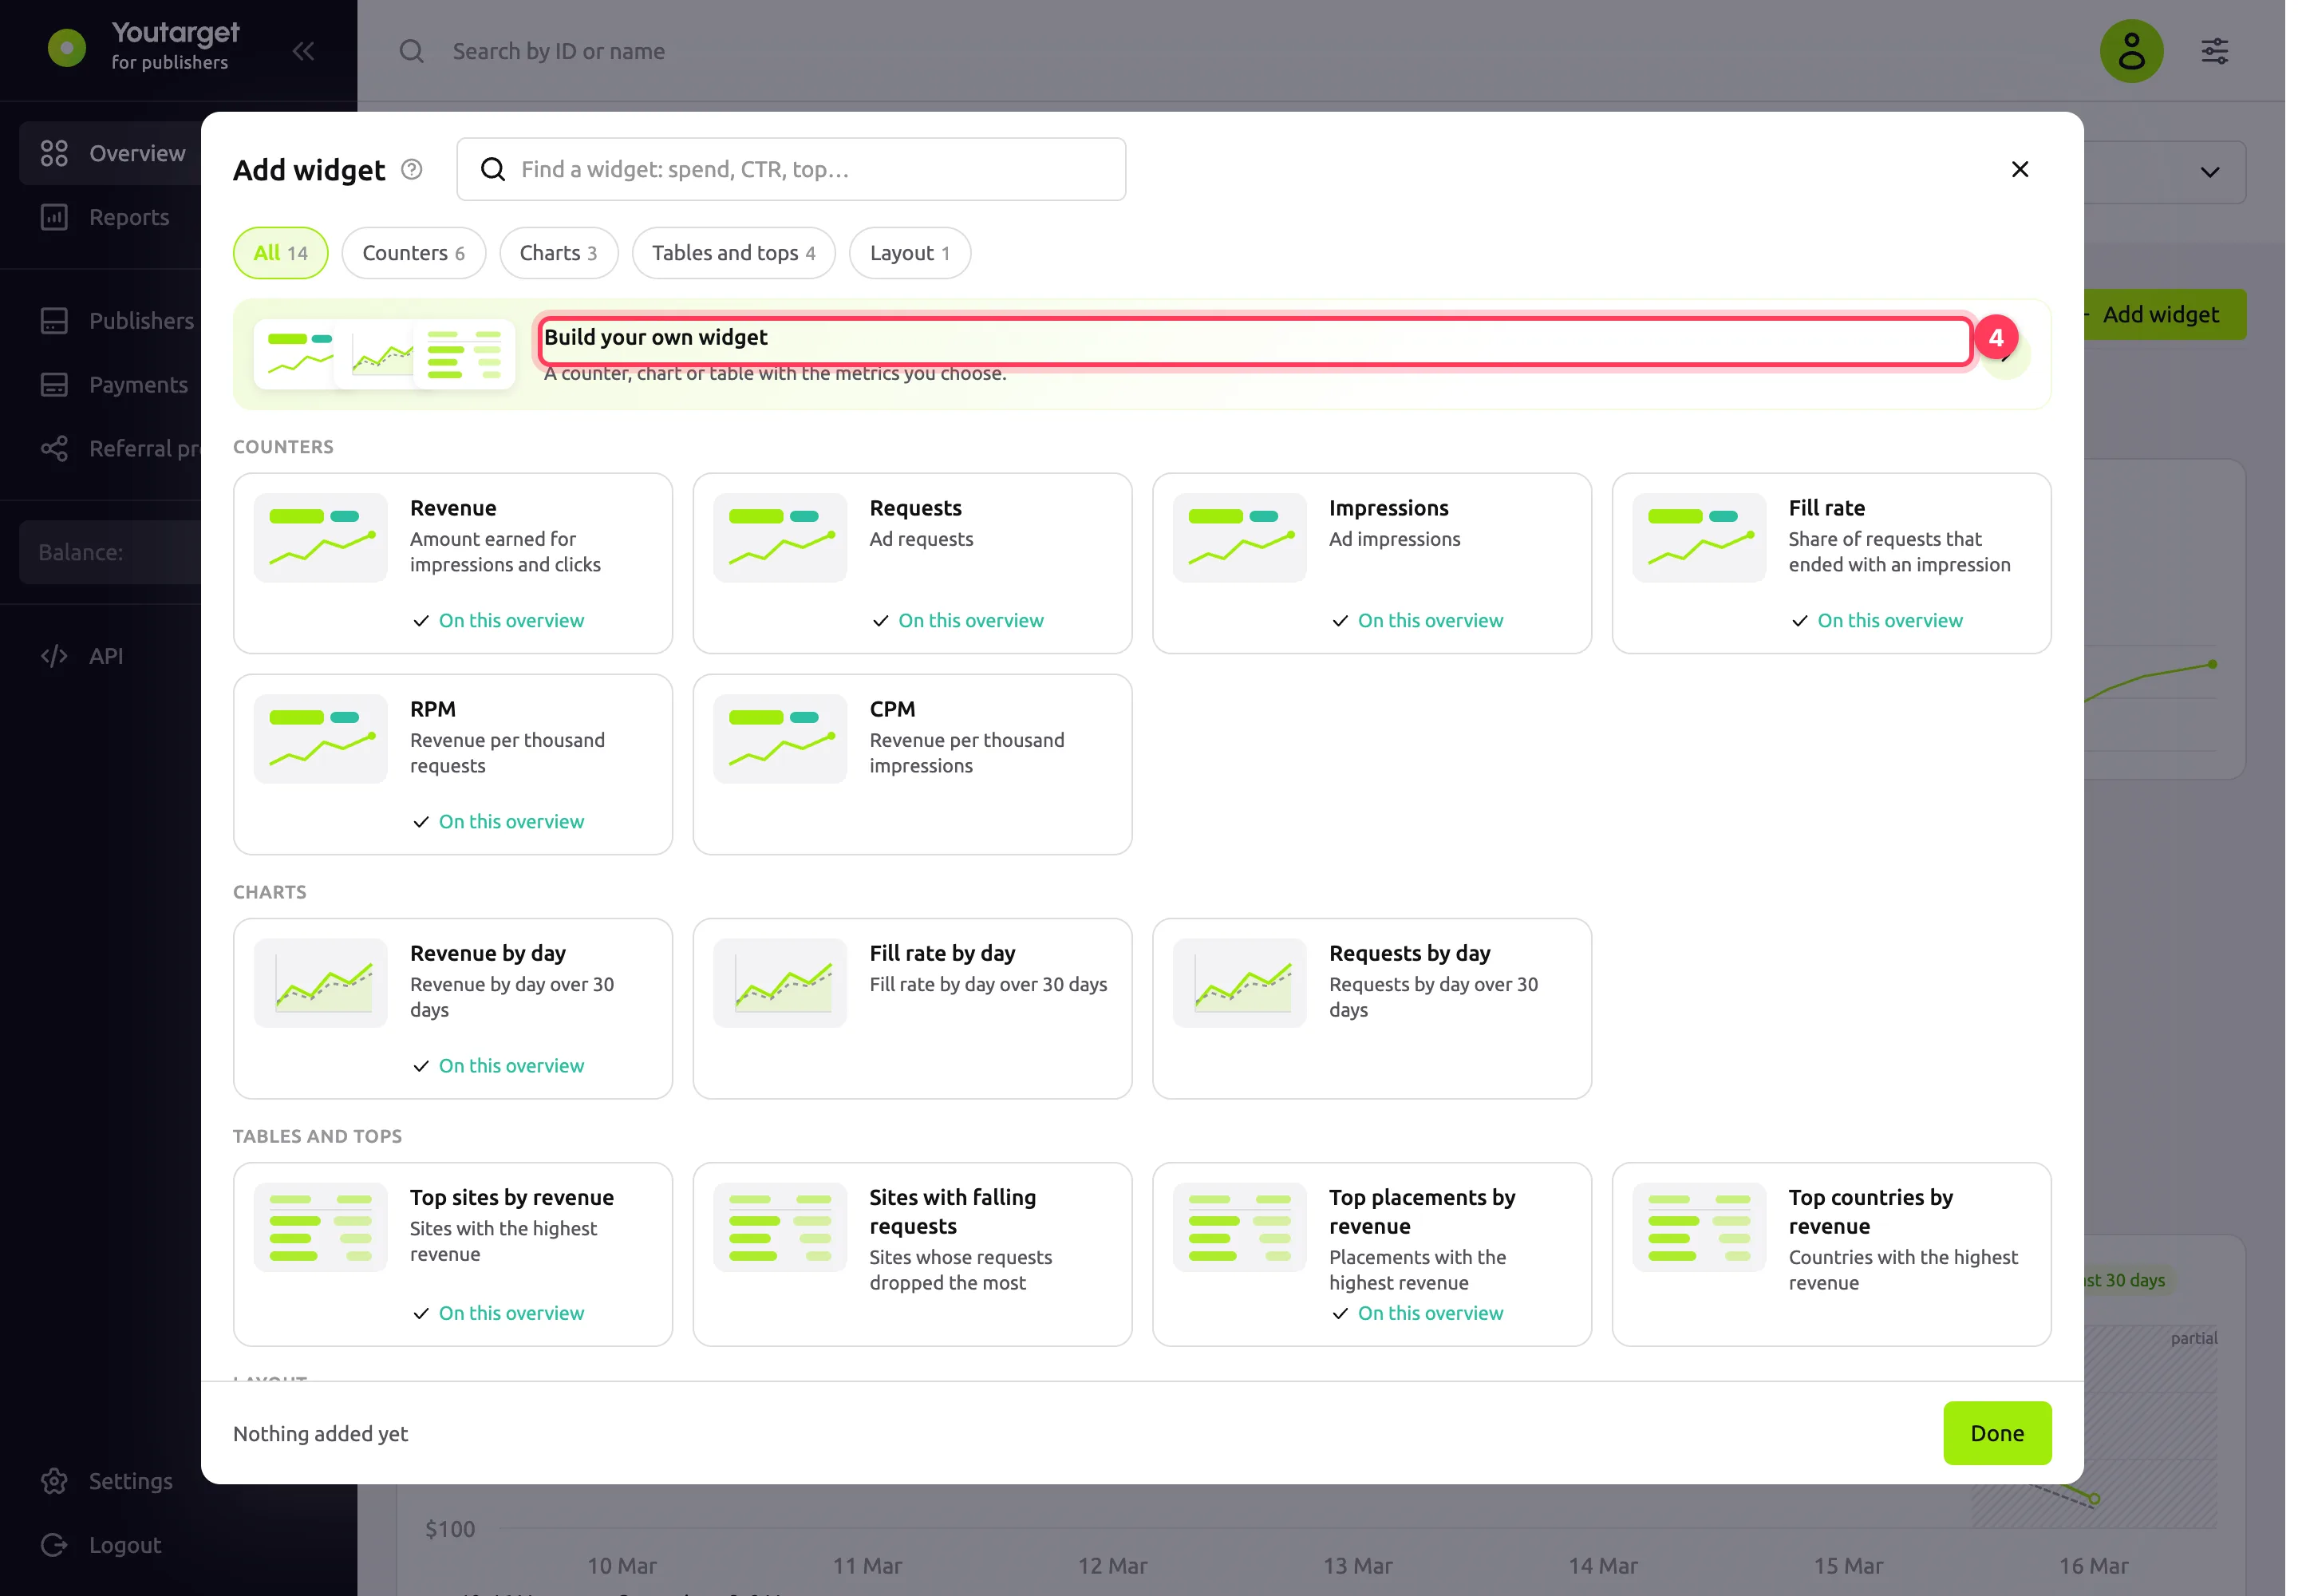
To add a widget, click Add widget. Select a ready-made widget in the catalog or click Build your own widget. Ready-made widgets: revenue, requests, impressions, Fill Rate, RPM and CPM counters; revenue, Fill Rate and requests by day charts; top sites, placements and countries by revenue; sites with falling requests.
Set up the widget in the Widget setup panel: type, metric, breakdown, period and filter. Click Add to overview, then Done.
To change a widget, hover over it and click the Widget settings gear.
To rearrange widgets or change their size, click Customize, drag the widgets and click Save.
To create another overview, click + overview to the right of the tabs, enter a name, select From cabinet template or Empty and click Create.
Result
The overview shows widgets with data for the selected period:
- A counter shows the value and the change against the same length of time immediately before the period. Fill Rate changes in percentage points (pp), other metrics in percent.
- A chart plots points by hour, day or week, depending on the period length. A day that has not ended yet is labeled partial.
- A table shows the value, the change and the value for the comparison period.
Statistics are calculated by full hours. Amounts are in the currency from Settings → Currency in statistics.
Use the menu next to the overview tab name to rename the overview, make it the main one, copy it, reset it to the template or delete it. You cannot delete the last overview.
Troubleshooting
| Symptom | Cause | Fix |
|---|---|---|
| "No statistics for the selected period" | There were no requests during the period | Select a longer period |
| "Today's data will appear soon" | The first hour of the day has not ended yet | Wait or select Yesterday |
| "Too much data" | A long period or a breakdown with many values | Shorten the period or remove the breakdown |
| "No more room on this overview" | The overview has the maximum number of widgets | Remove a widget you do not need or create a new overview |
Next steps
- Revenue reports: when you need deeper statistics than the overview gives.
- Metrics