
Revenue reports
Goal
See revenue broken down the way you need: for example, by each publisher and, inside it, by country. This shows which publishers and countries earn more and where Fill Rate is low.
Before you start
- Publishers that have already received requests. If there were no requests in the selected period, the report is empty.
Steps
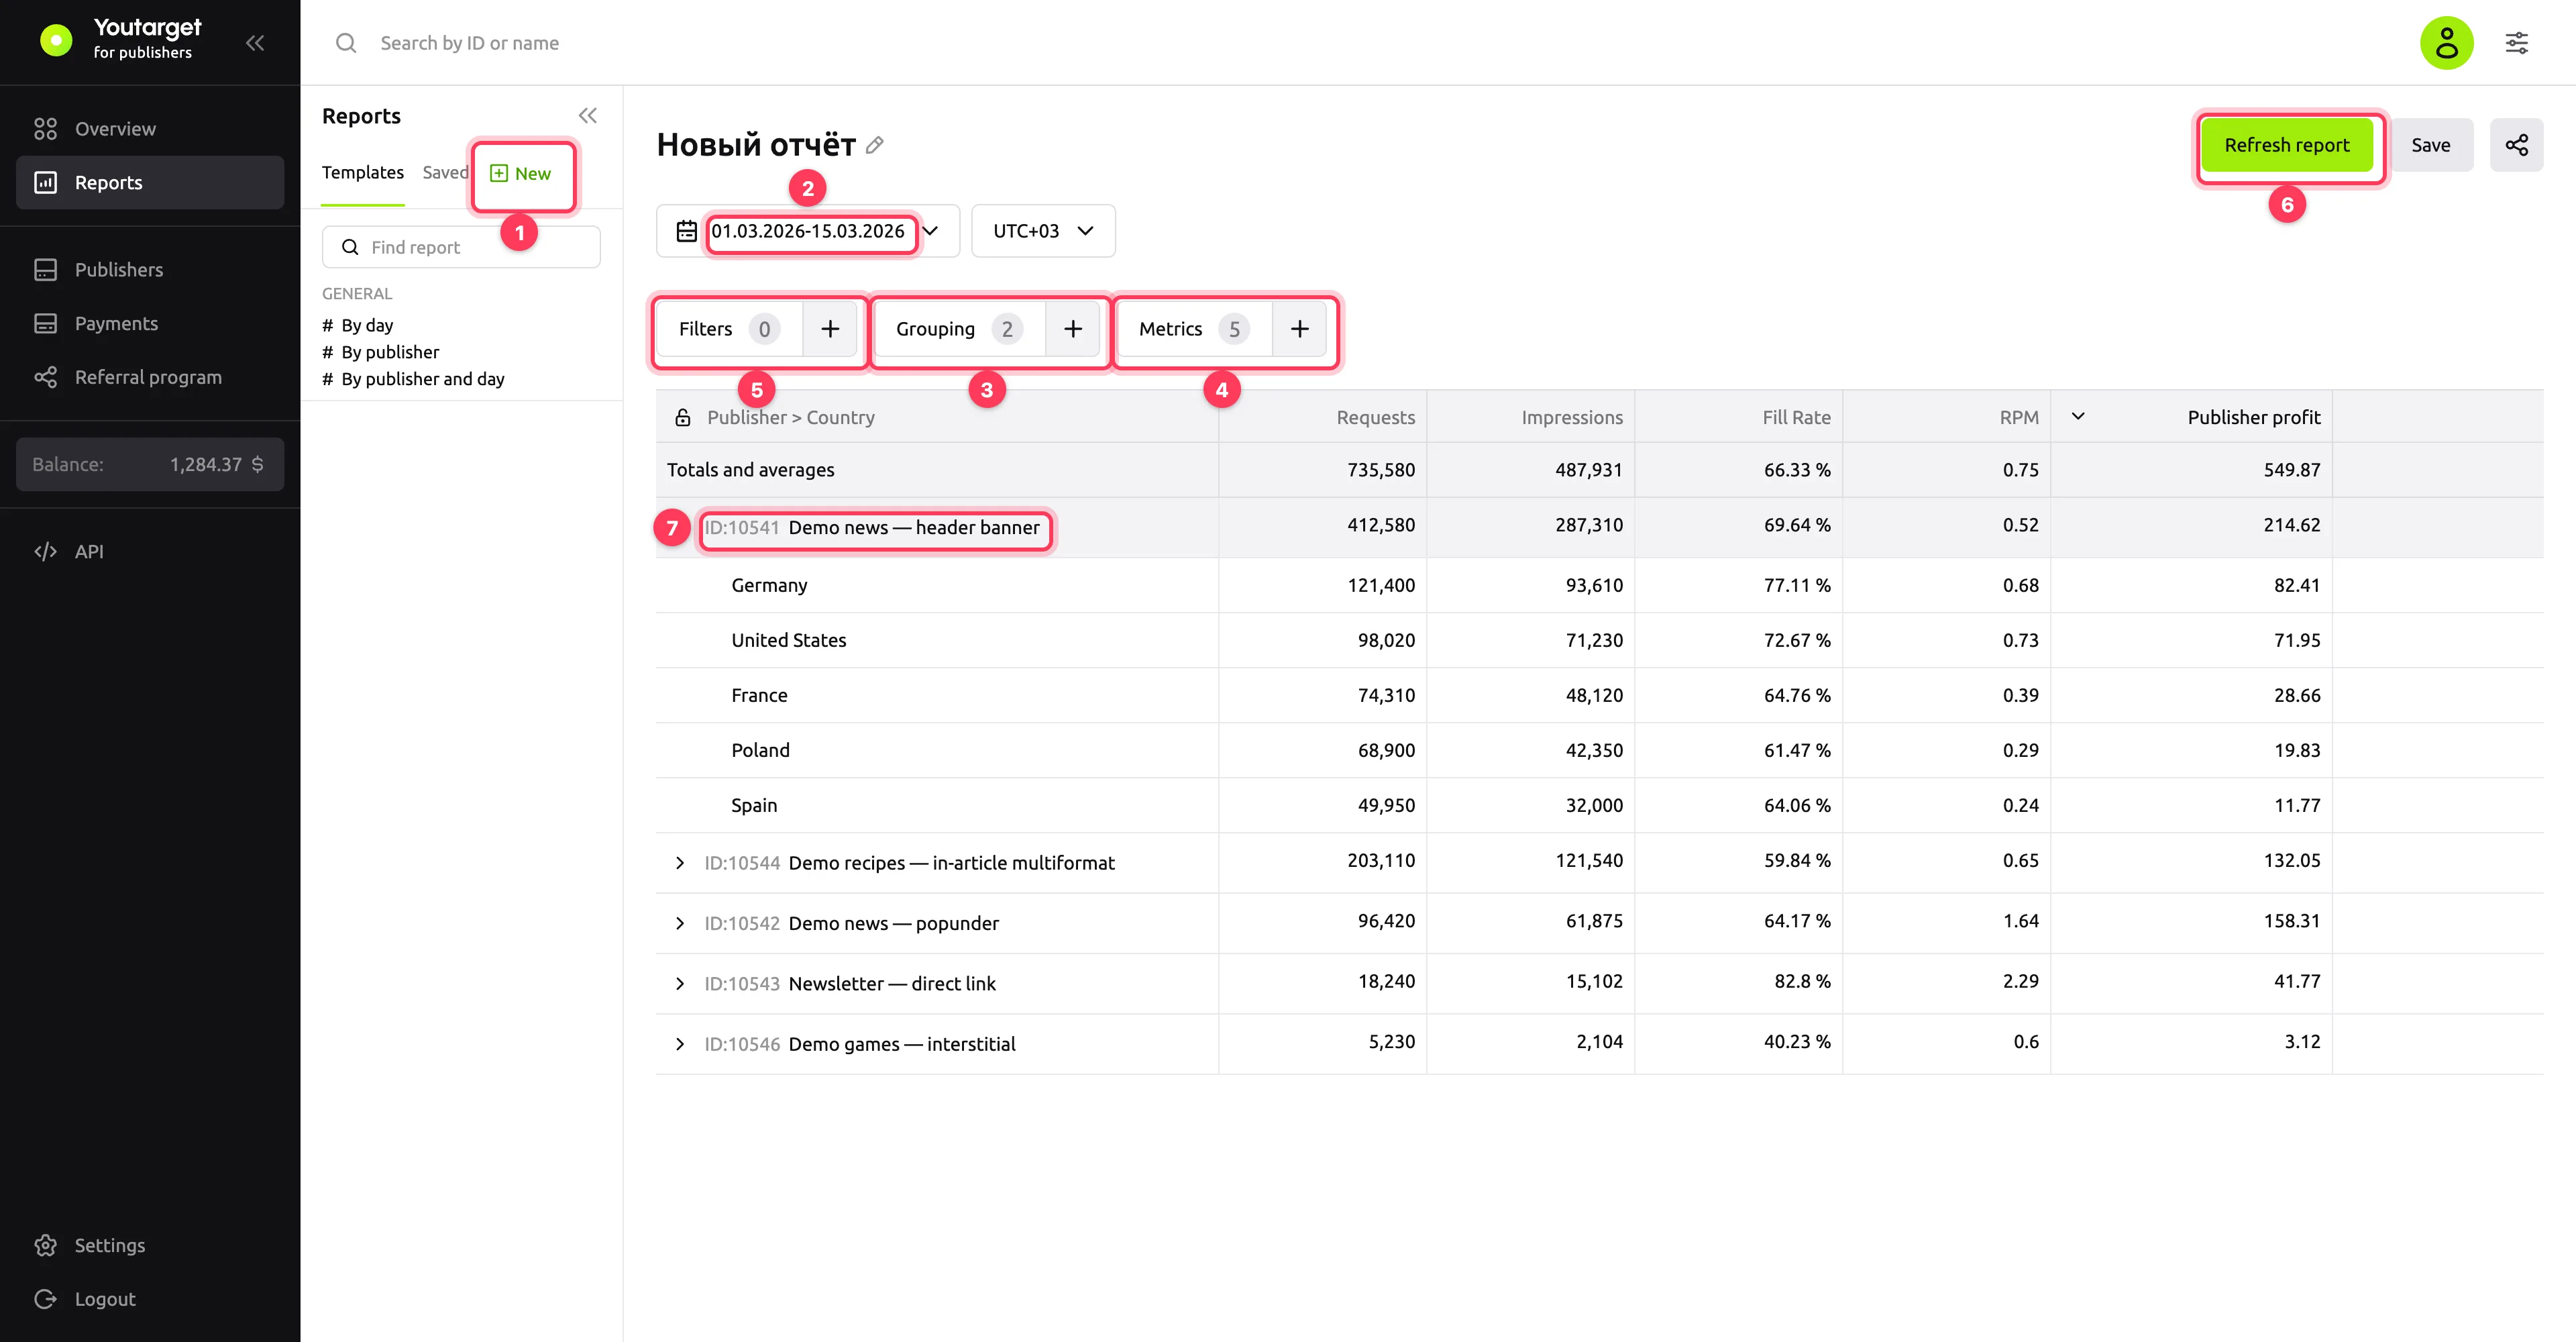
In the left menu, open Reports. To start from a ready-made set, select a template on the Templates tab: By day, By publisher or By publisher and day. To build a report from scratch, click New.
Select a period in the date field. To the right of it is the report time zone.
Click Grouping, select the ones you need, for example Publisher and Country, and click Apply. The order in the list on the right is the nesting order: the first grouping gives the table rows, and the second one expands inside each row. To swap levels, drag a grouping.
Click Metrics, select the ones you need, for example Requests, Impressions, Fill Rate, RPM and Publisher profit, and click Apply. The Metrics reference explains each metric.
To keep only part of the statistics, for example one publisher or country, click Filters, select a filter on the left, select values and click Apply.
Click Refresh report. The report is built only with this button: after you change the period, groupings, metrics or filters, click it again.
Click the arrow to the left of a row to expand the next grouping level.
Result
The table shows the totals row for the whole report and the rows of the first grouping. Each level first loads 100 rows; load the rest with the button under the table.
Groupings
| Group | Groupings |
|---|---|
| Date | Date: by hour, day, week or month |
| Object | Publisher, Zone ID |
| Geo | Country |
| Inventory and Targeting | Connection type, Device, Operating system, Browser, Language |
Zone ID splits the traffic of one publisher by the zone_id value from the link. For how to set it, see Direct link.
A report can have up to 7 groupings.
Save and share
- Save → Save as new: the report appears on the Saved tab. The period, groupings, metrics and filters are saved.
- Save → Save current: overwrite the open saved report.
- To rename the report, click the pencil icon next to the title.
- The share icon button copies a link to the report with all its settings.
- In the Saved list, you can rename a report, add it to favorites, mark it with a color or delete it.
TIP
A quick way to see the statistics of one publisher is the Report item in the publisher menu in the Publishers list.
Troubleshooting
| Symptom | Cause | Fix |
|---|---|---|
| The Refresh report button is inactive | No metrics or groupings are selected | Add at least one grouping and one metric |
| You changed the settings, but the table did not change | The report does not rebuild on its own | Click Refresh report |
| "The period is too long. The maximum period = 183 days" | The period is longer than 183 days | Shorten the period or split it into several reports |
| "The period is too long. For this grouping maximum period = 8 days" | Grouping by hour for a period longer than 8 days | Select grouping by day or shorten the period |
| "Date filtering must start on Monday for weekly grouping" | Grouping by week, and the period does not start on a Monday | Start the period on a Monday |
| "Date filtering must start on the 1st for monthly grouping" | Grouping by month, and the period does not start on the 1st | Start the period on the 1st of a month |
| You cannot select one more grouping | 7 groupings are already selected | Remove a grouping you do not need |
Next steps
- Overview: an ongoing summary without setting up a report.
- No impressions or revenue