
Build a report with nested groupings
Goal
See statistics broken down the way you need: for example, by each campaign and, inside it, by the zonesA specific ad slot on a site or in an app, for example a block on a site page. where it ran. This shows which placements spend the budget without clicks and conversionsA target user action after an ad click: a purchase, a lead, a sign-up.. You can save the finished report, share it as a link or export it to CSV and XLSX.
Before you start
- Campaigns that have already run. If there were no impressions in the selected period, the report is empty.
- For conversions, CR, CPAThe cost of one conversion. and ROI, a configured postback. Without it, the report has no conversions and CPA is empty.
Steps
In the left menu, open Reports and click New. If a ready-made set fits, select a template on the Templates tab, for example Campaigns or Geography. For the groupings and metrics of each template, see the Reports reference.
Open the date field and select a period. By default, it is the last month up to today. To the right of the field is the report time zone, UTC+03 by default.
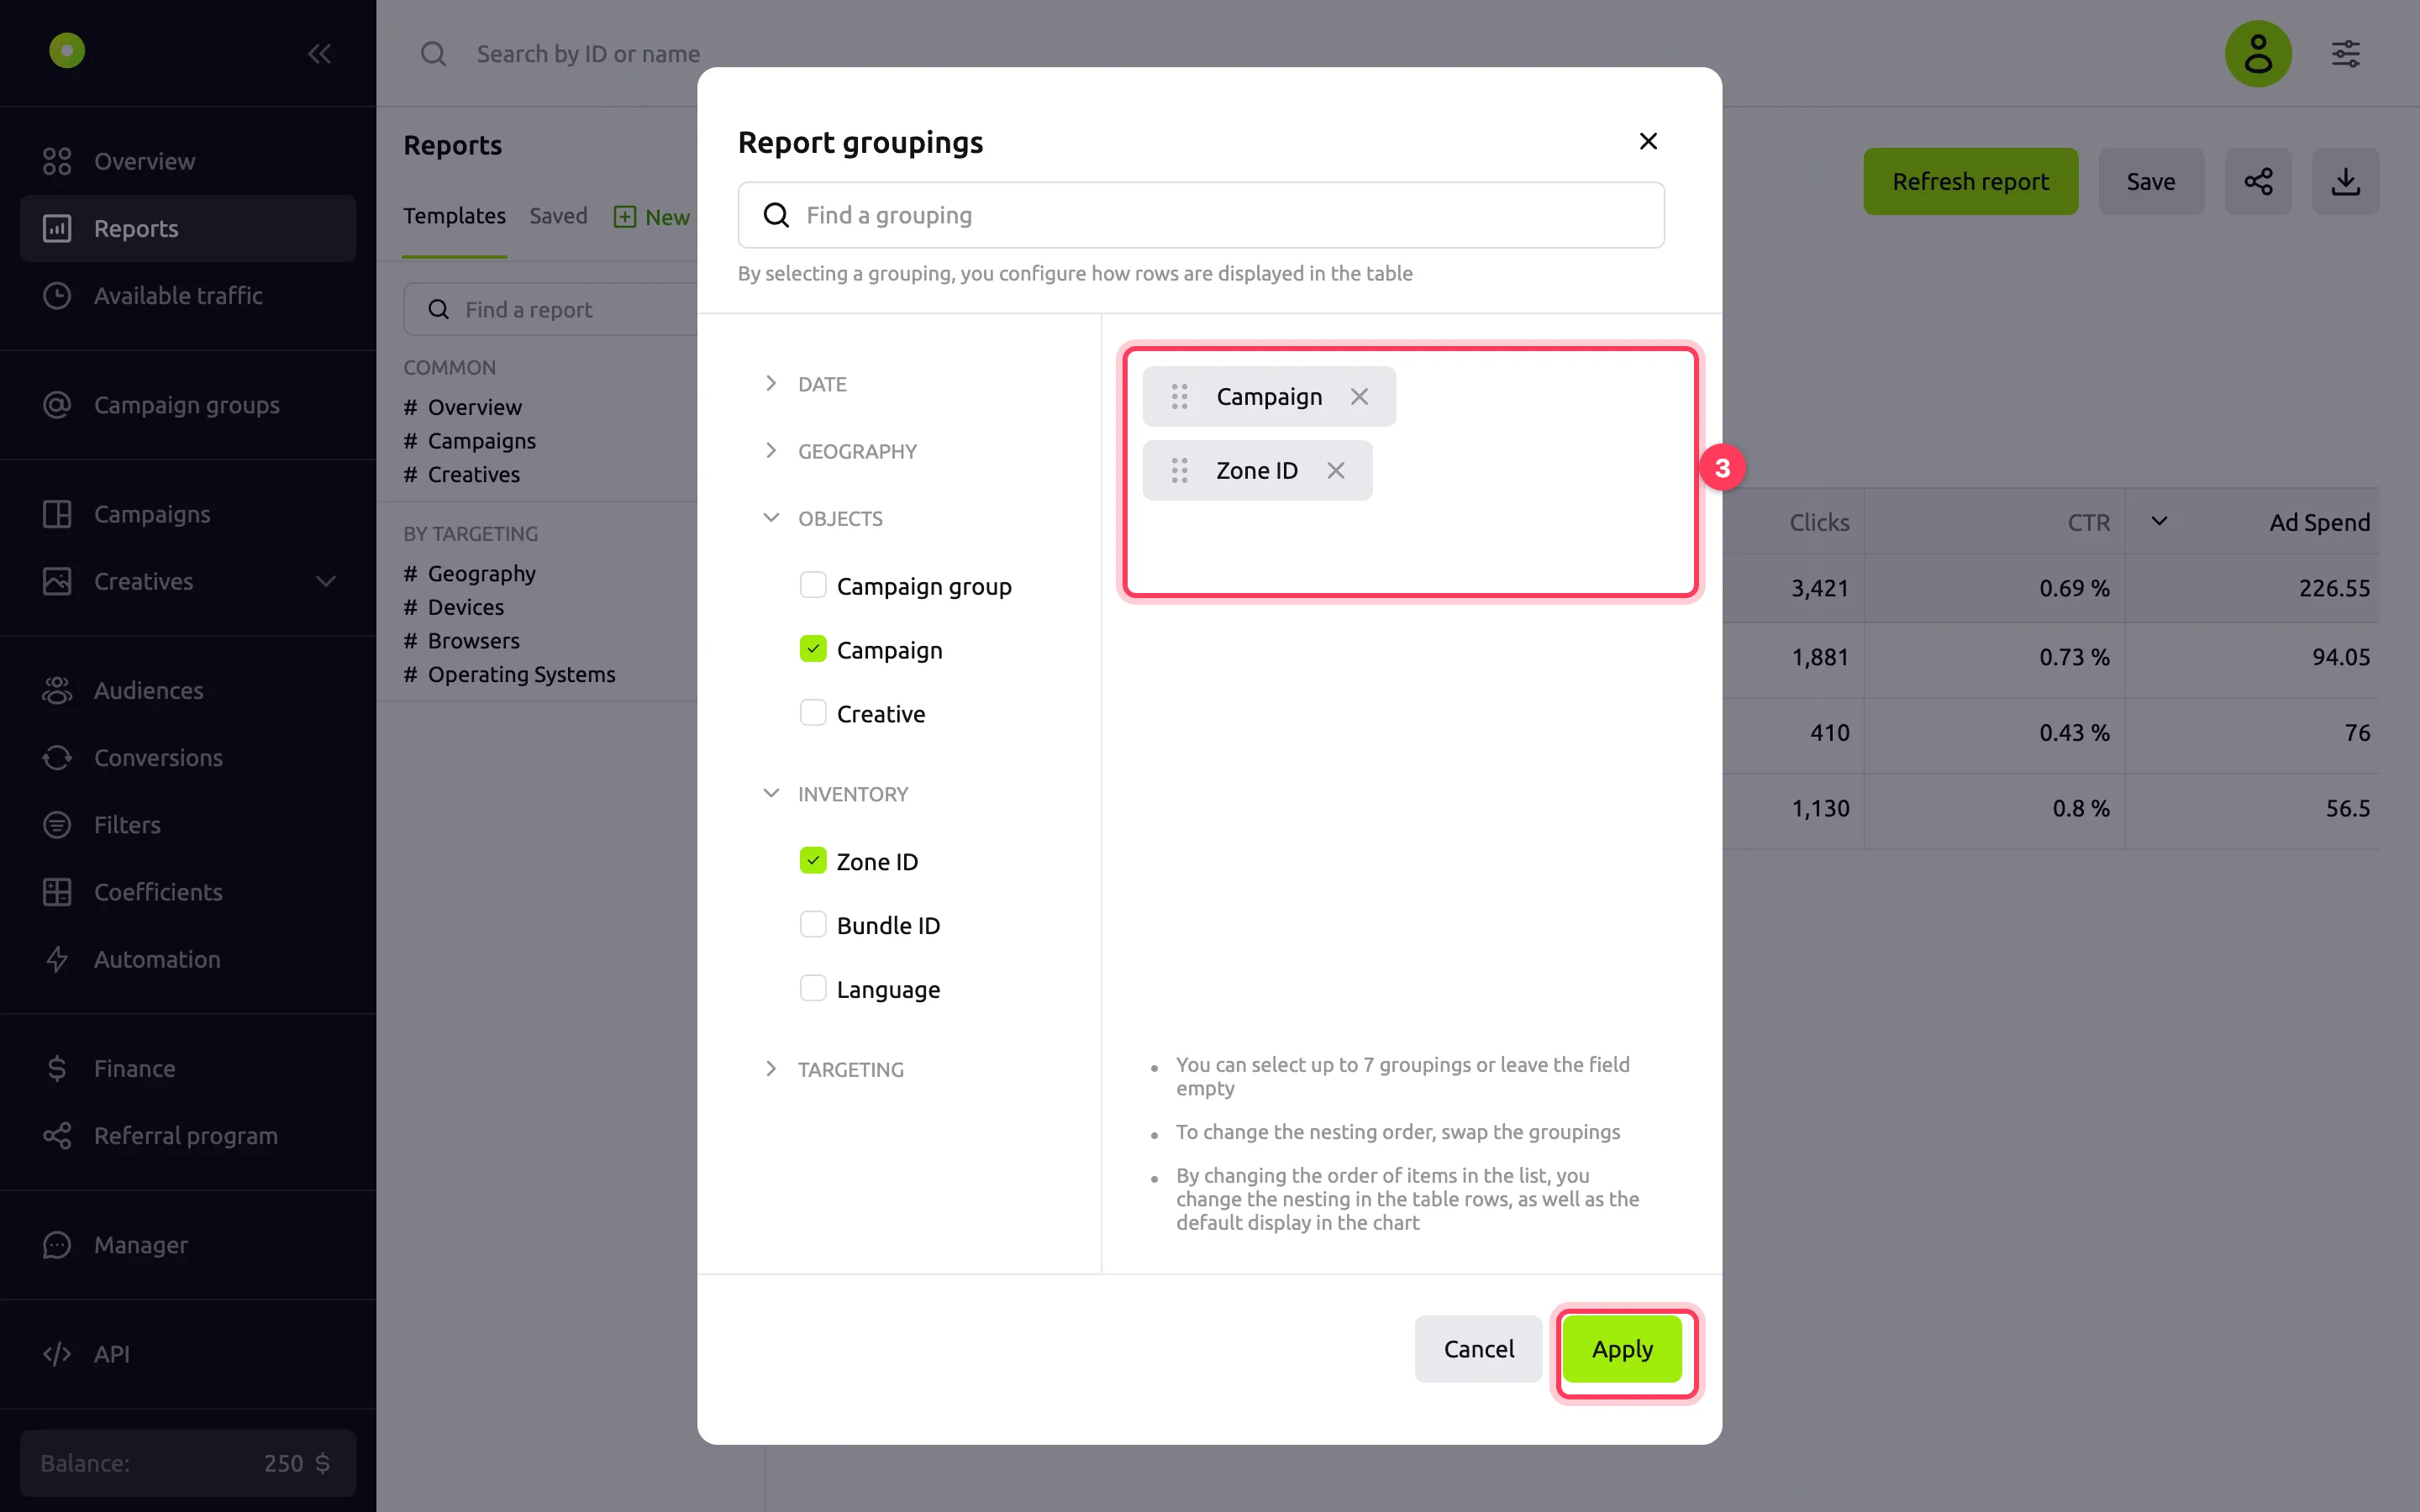
Click + next to Group by. Select Campaign and Zone ID and click Apply. The order in the list on the right is the nesting order: the first grouping gives the table rows, and the second one expands inside each row. To swap levels, drag a grouping by the icon to the left of its name.
Click + next to Metrics, select the ones you need, for example Impressions, Clicks, CTR, Ad Spend, CPA and ROI, and click Apply. The Reports reference explains each metric.
To keep only part of the statistics in the report, for example one campaign or country, click + next to Filters. Select a filter in the list on the left, select values and click Apply.
Click Refresh report. The report is built only with this button: after you change the period, time zone, groupings, metrics or filters, click it again.
Click the arrow to the left of the campaign name. The zones where the campaign ran open under it, each with its own statistics.
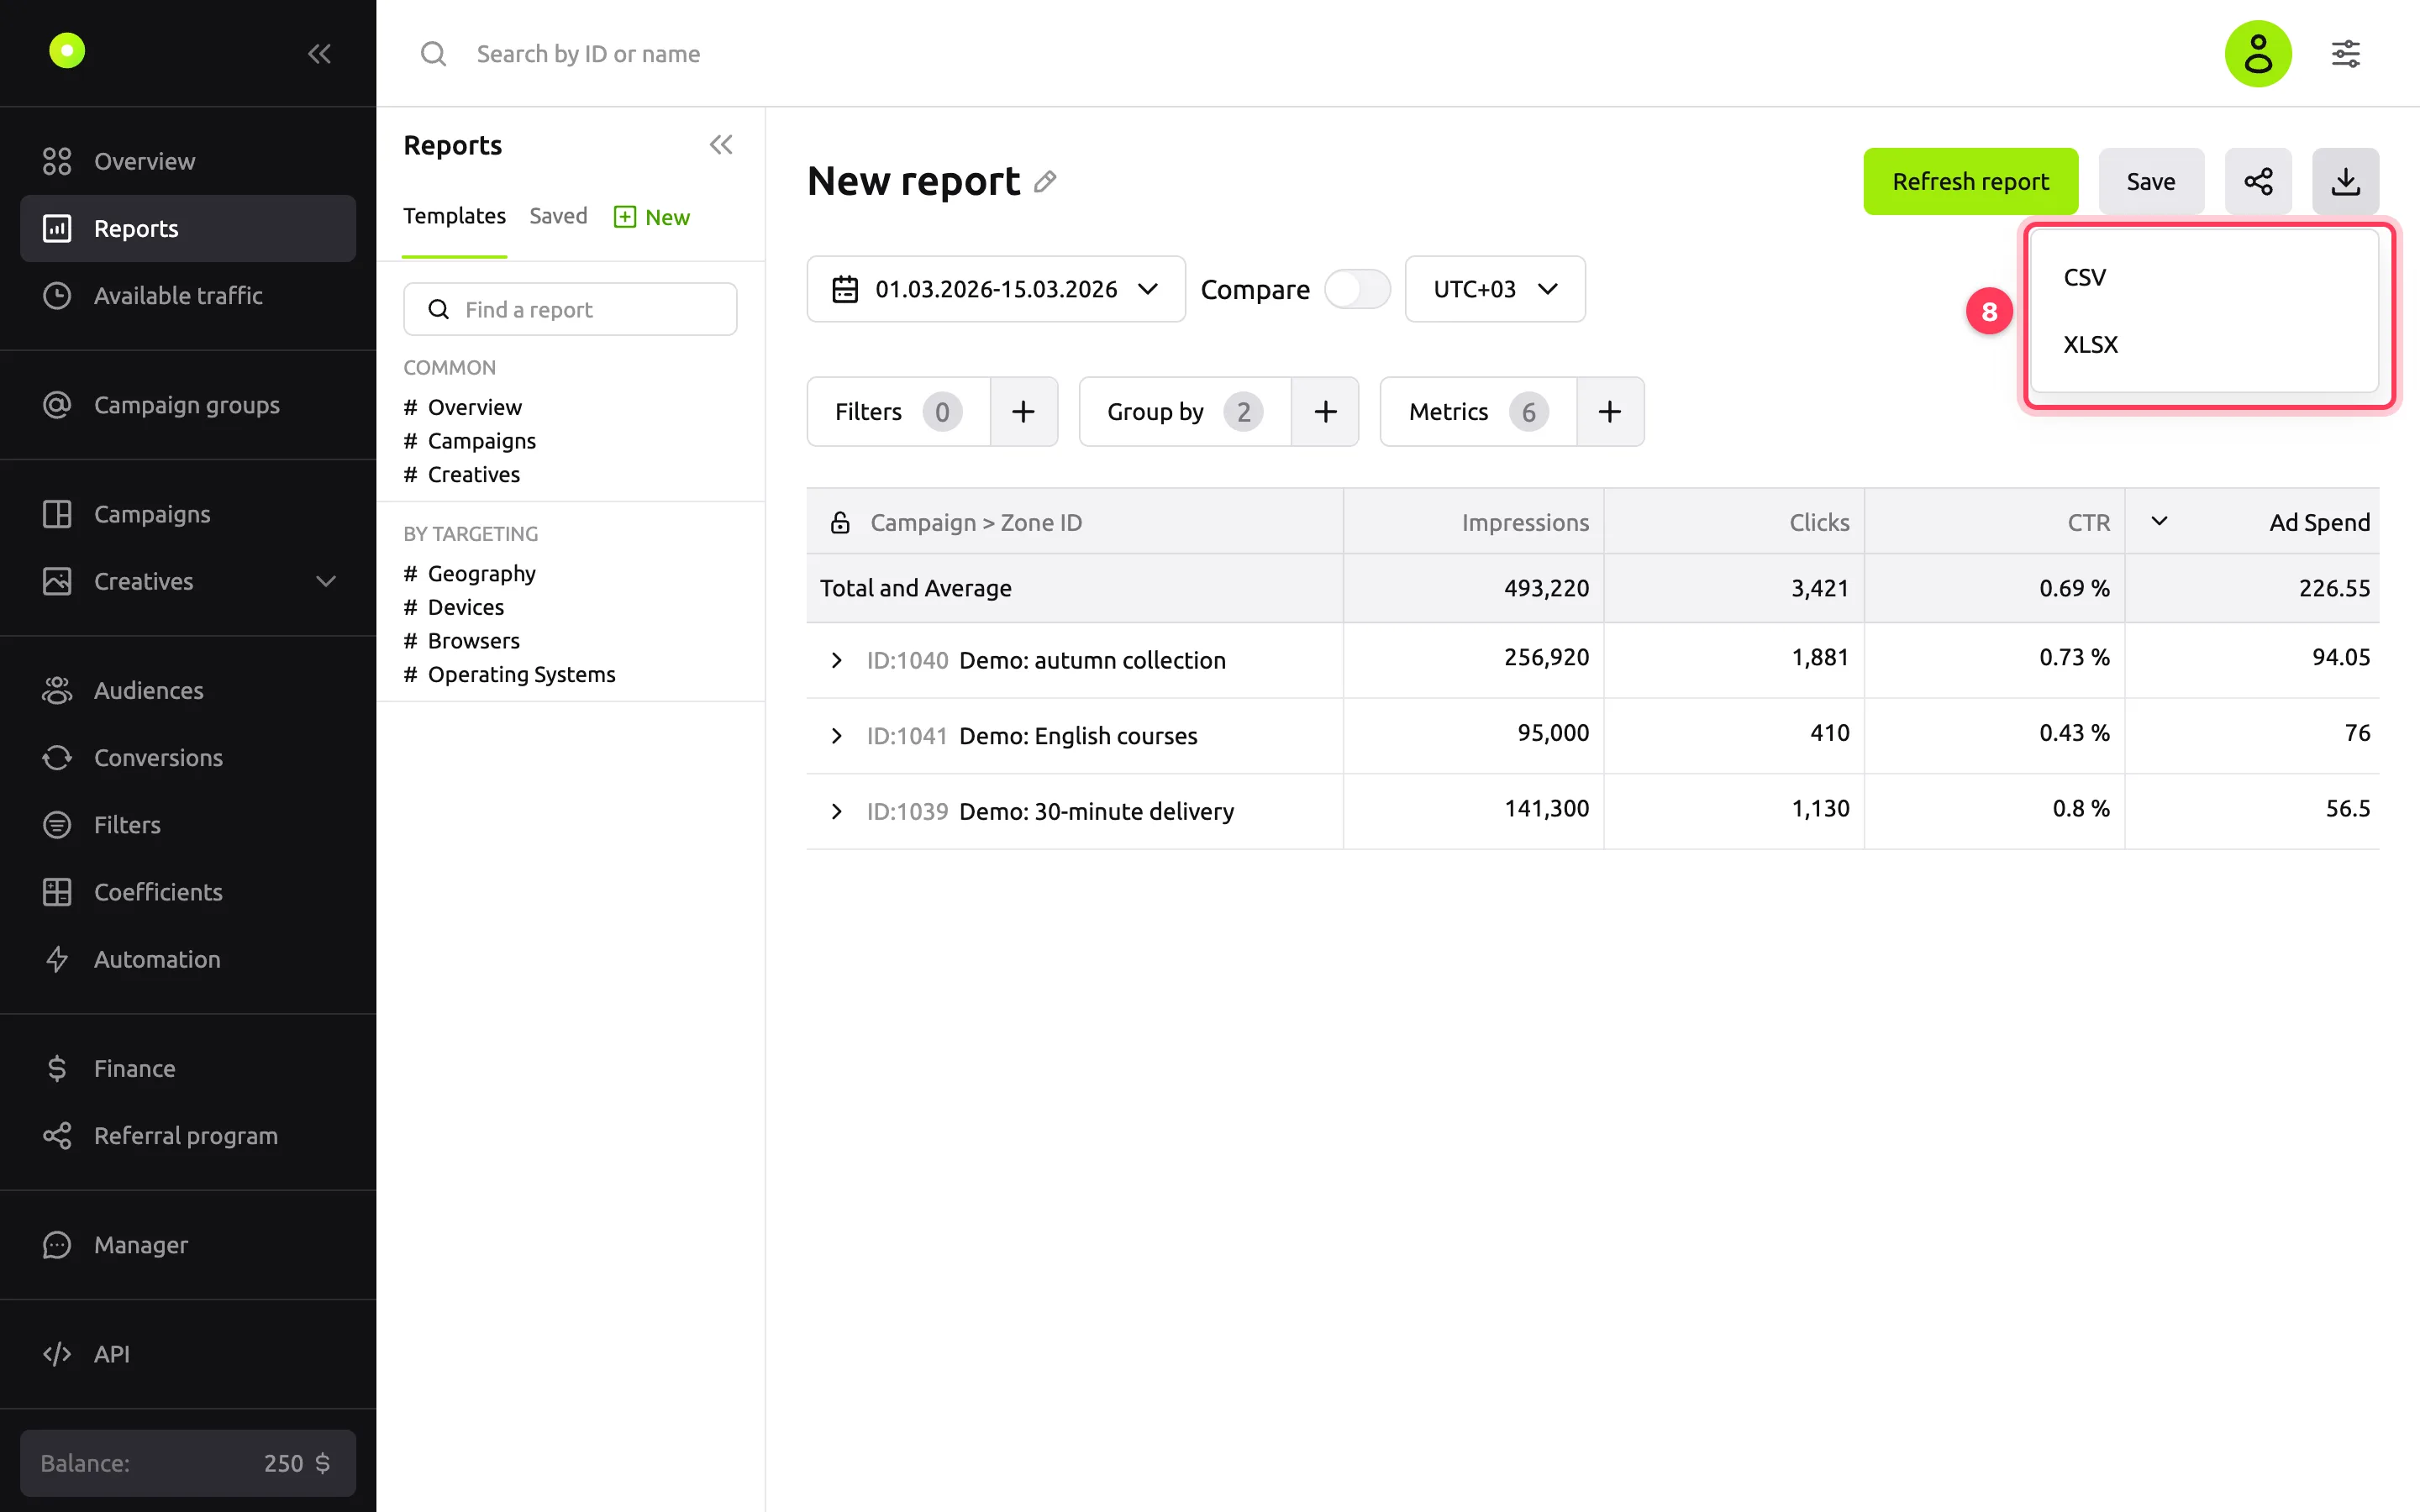
To export the report, click the download icon in the top-right corner and select CSV or XLSX.
Result
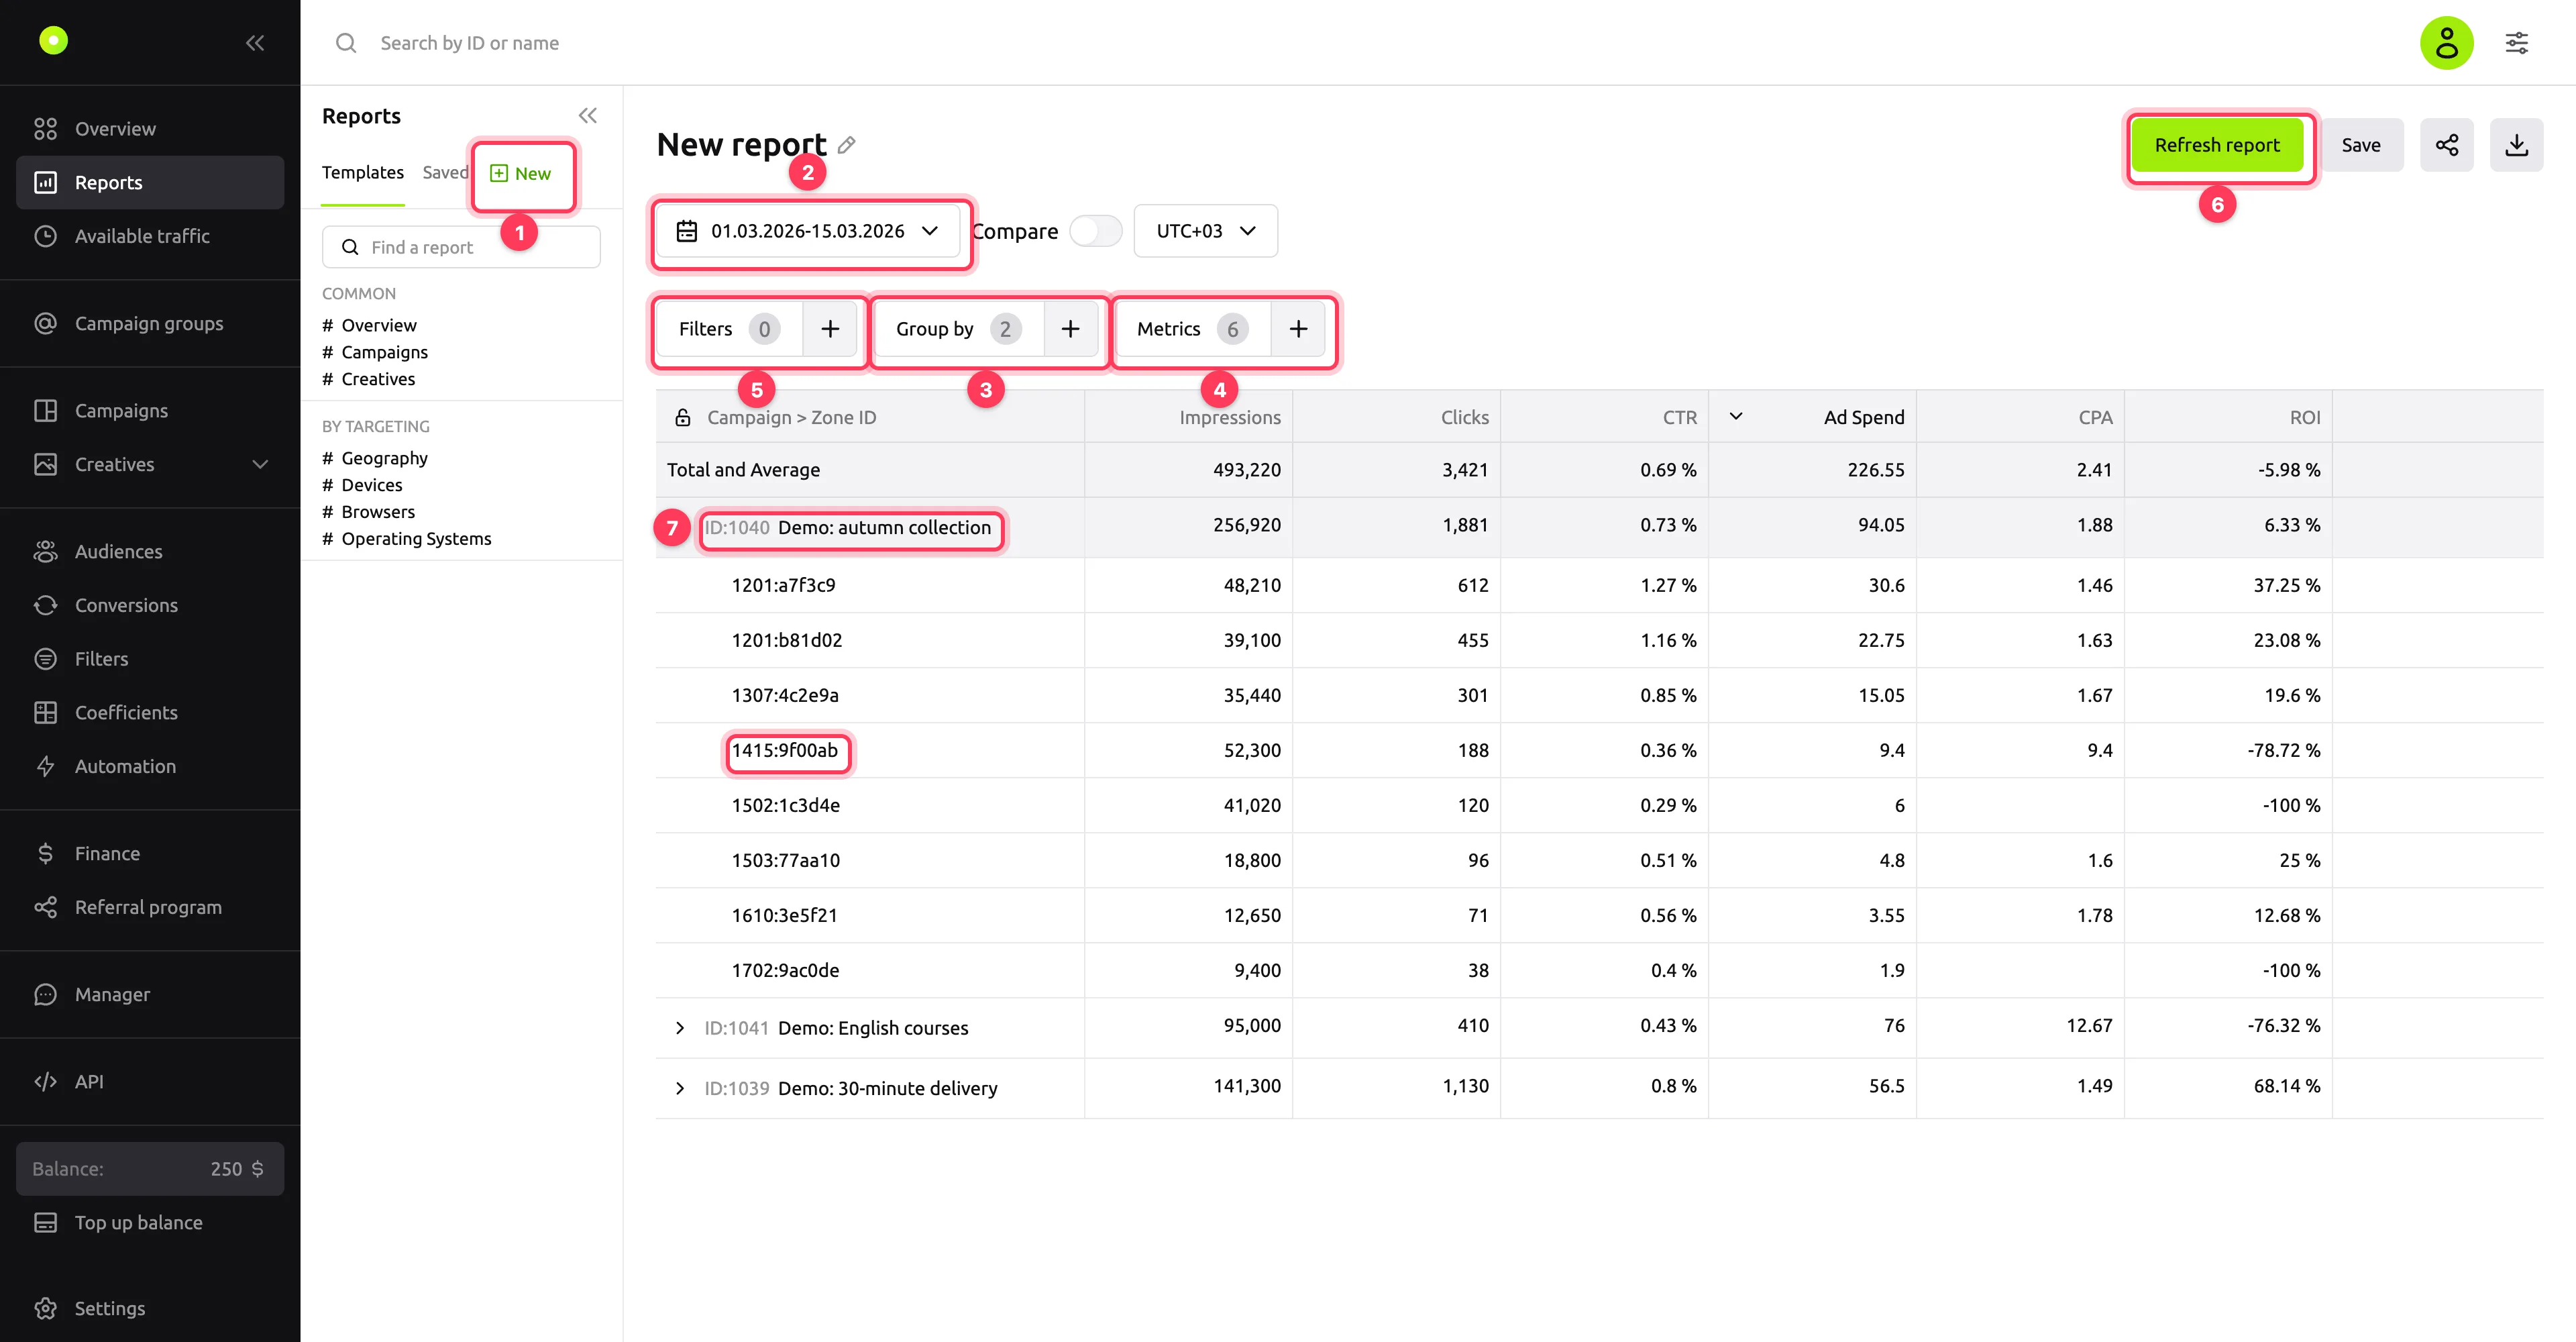
The table shows the Total and Average row for the whole report and the rows of the first grouping. In the screenshot, zone 1415:9f00ab of the "Demo: autumn collection" campaign got the most impressions, but it has one of the lowest CTRs, one conversion and ROI of −78.72%. Lower the bid for such a zone or turn it off. Zone 1502:1c3d4e has no conversions at all, so its CPA cell is empty.
- Sorting. Click a metric column header. Among groupings, only the first one can be sorted, and only if it is Date, Campaign group, Campaign, Creative, Zone ID or Bundle ID.
- More rows. Each level first loads 100 rows; load the rest with the Load more button.
- First column. The lock icon in its header pins the grouping column when you scroll right.
- Column order. Drag a metric column header to a new position. The order is remembered in this browser, applies to all reports and is kept in the export.
Export
The file contains one flat table: each row is a combination of all groupings, for example "campaign + zone". Columns follow the same order as in the table on the screen. The file name includes the report name, the export date and time, and the time zone. If period comparison is on, the file includes the values for both periods and the change.
Compare two periods
Turn on Compare next to the date field and select a second period. The periods must not overlap. The arrows button between the fields swaps the periods. Click Refresh report: each cell shows the value for the main period, the value for the comparison period and the change in percent. If the metric was zero in the comparison period and above zero in the main period, the change is shown as +100%.
Save and share
- Save → Save as new: the report appears on the Saved tab. The period, time zone, comparison, groupings, metrics and filters are saved. Dates are saved as is: a report for March 1–15 opens for the same days a month later.
- Save → Save current: overwrite the open saved report. This item appears only when a saved report is open, not a template.
- To rename the report, click the pencil icon next to the title.
- The icon to the left of the download icon copies a link to the report with all its settings to the clipboard.
- In the Saved list, you can rename a report, add it to favorites, mark it with a color or delete it. Favorites and colors are stored only in this browser.
After you open a template or a saved report, click Refresh report to load the data.
TIP
A quick way to see the statistics of one campaign is the Report item in the campaign menu in the campaign list. It opens a ready-made report by day for the last 7 days, filtered by this campaign, in a new tab. The creative and campaign group menus have the same item.
Troubleshooting
| Symptom | Cause | Fix |
|---|---|---|
| The Refresh report button is inactive, with the hint "To generate a report, you need to select at least one metric and grouping" | No metrics or groupings are selected | Add at least one grouping and one metric |
| You selected a template or changed the settings, but the table did not change | The report does not rebuild on its own | Click Refresh report |
| The download icon is inactive | The report is not built yet or is loading | Click Refresh report and wait for the table |
| "The period is too long. The maximum period = 183 days" | The main period or the comparison period is longer than 183 days | Shorten the period or split it into several reports |
| "Date filtering must start on Monday for weekly grouping" | By week is selected in the Date grouping, and the period does not start on a Monday | Start the period on a Monday |
| "Date filtering must start on the 1st for monthly grouping" | By month is selected, and the period does not start on the 1st | Start the period on the 1st of a month |
| "Comparison period cannot overlap with main period" | Comparison is on, and the periods overlap | Select a comparison period that does not include days of the main period |
| You cannot select one more grouping | 7 groupings are already selected | Remove a grouping you do not need |
| No conversions, CPA is empty | The postback is not set up, or conversions did not arrive | See Conversions are not coming in |
| Daily spend in the report does not match the daily limit | Limits are counted in UTC, and the report uses the selected time zone | See Spend is not what you expected |
Next steps
- Raise or lower the bid on specific placements: lower the bid in a weak zone without turning it off.
- Turn off poor placements with a filter: remove the zone from the campaign completely.
- Reports reference: metric formulas, templates and all groupings.
- Track metrics on the overview: an ongoing summary of your campaigns without setting up a report.