
Track metrics on the overview
Goal
See the key numbers on your campaigns on one page: spend, impressions, clicks, conversions and how they changed against the previous period. An overview is a set of widgets that you build yourself: counters, charts, tables and headings.
Before you start
- Campaigns with statistics. Without impressions, widgets show "No statistics for the selected period".
Steps
Open Overview in the left menu. The main overview opens: its tab has a star. When you first open the section, the dashboard creates an overview from its template: today's summary, spend by day, and the top campaigns and campaign groups by spend.
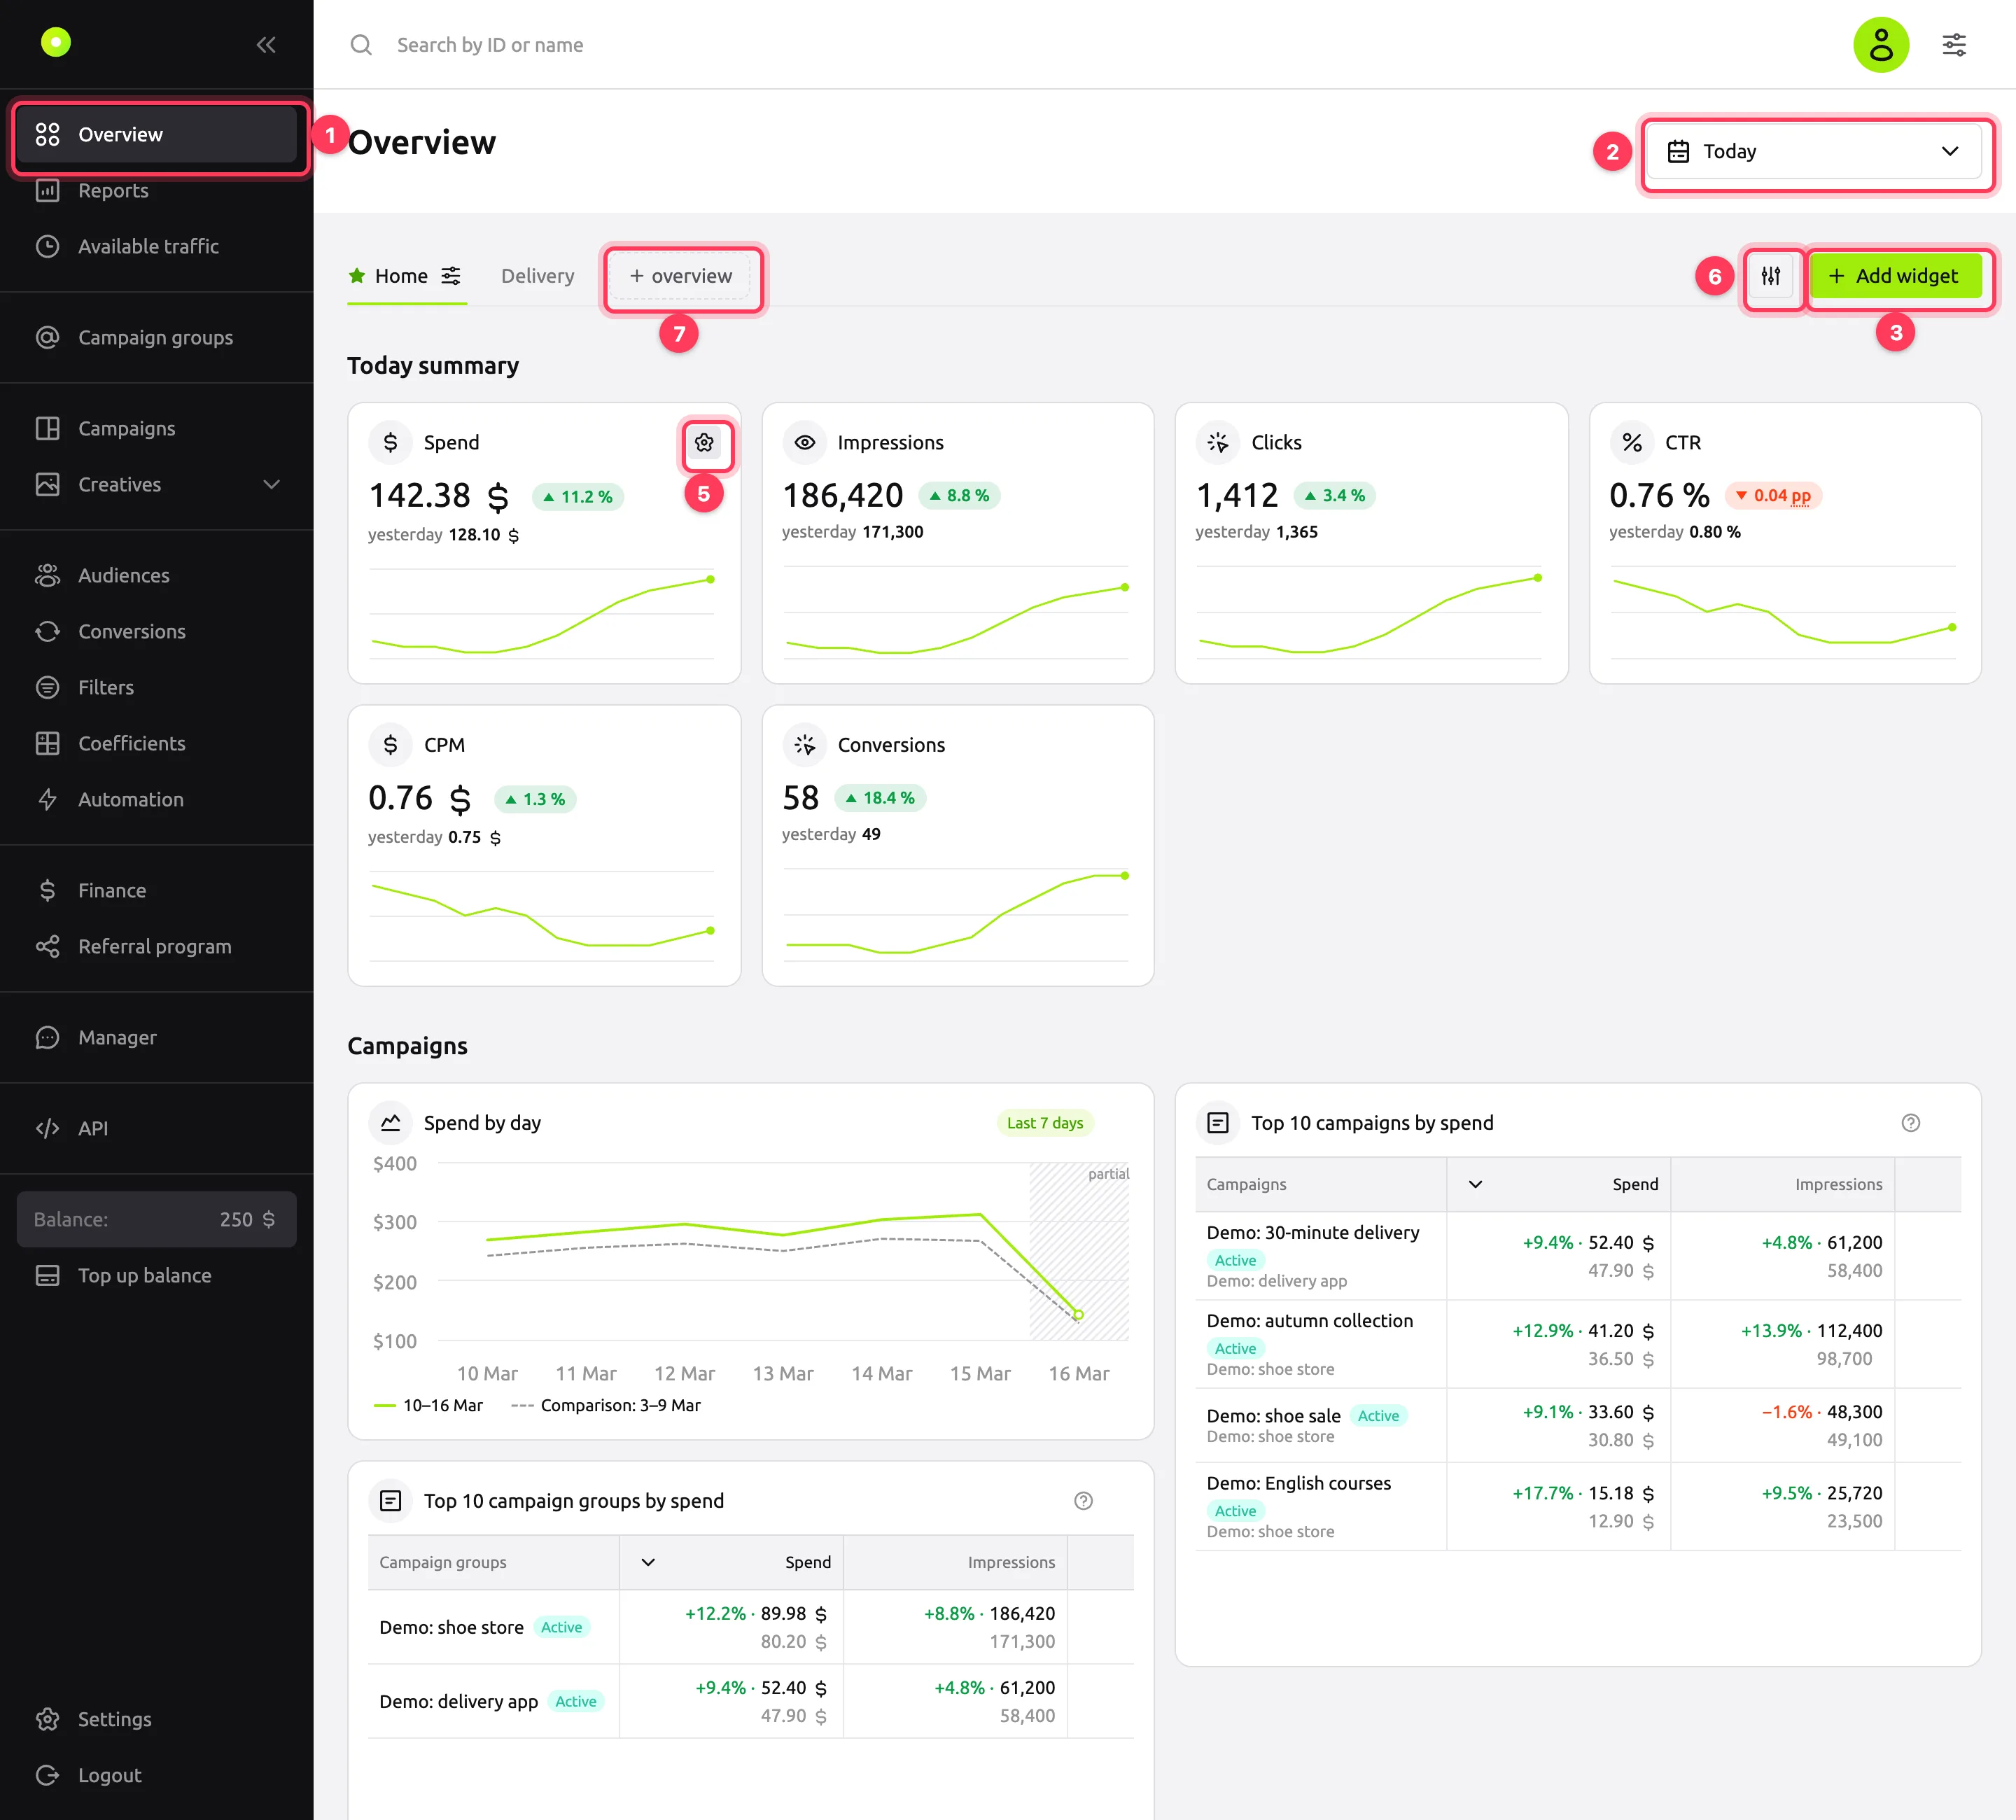
Select the period in the top right: Today, Yesterday, Last 7 days, Last 14 days, Last 30 days, Last 90 days, Last 6 months or your own dates, up to 366 days. A widget with its own period shows it as a badge in the header, and the common period does not apply to it. The selected period is not saved: the next time you open the section, the overview period comes back.
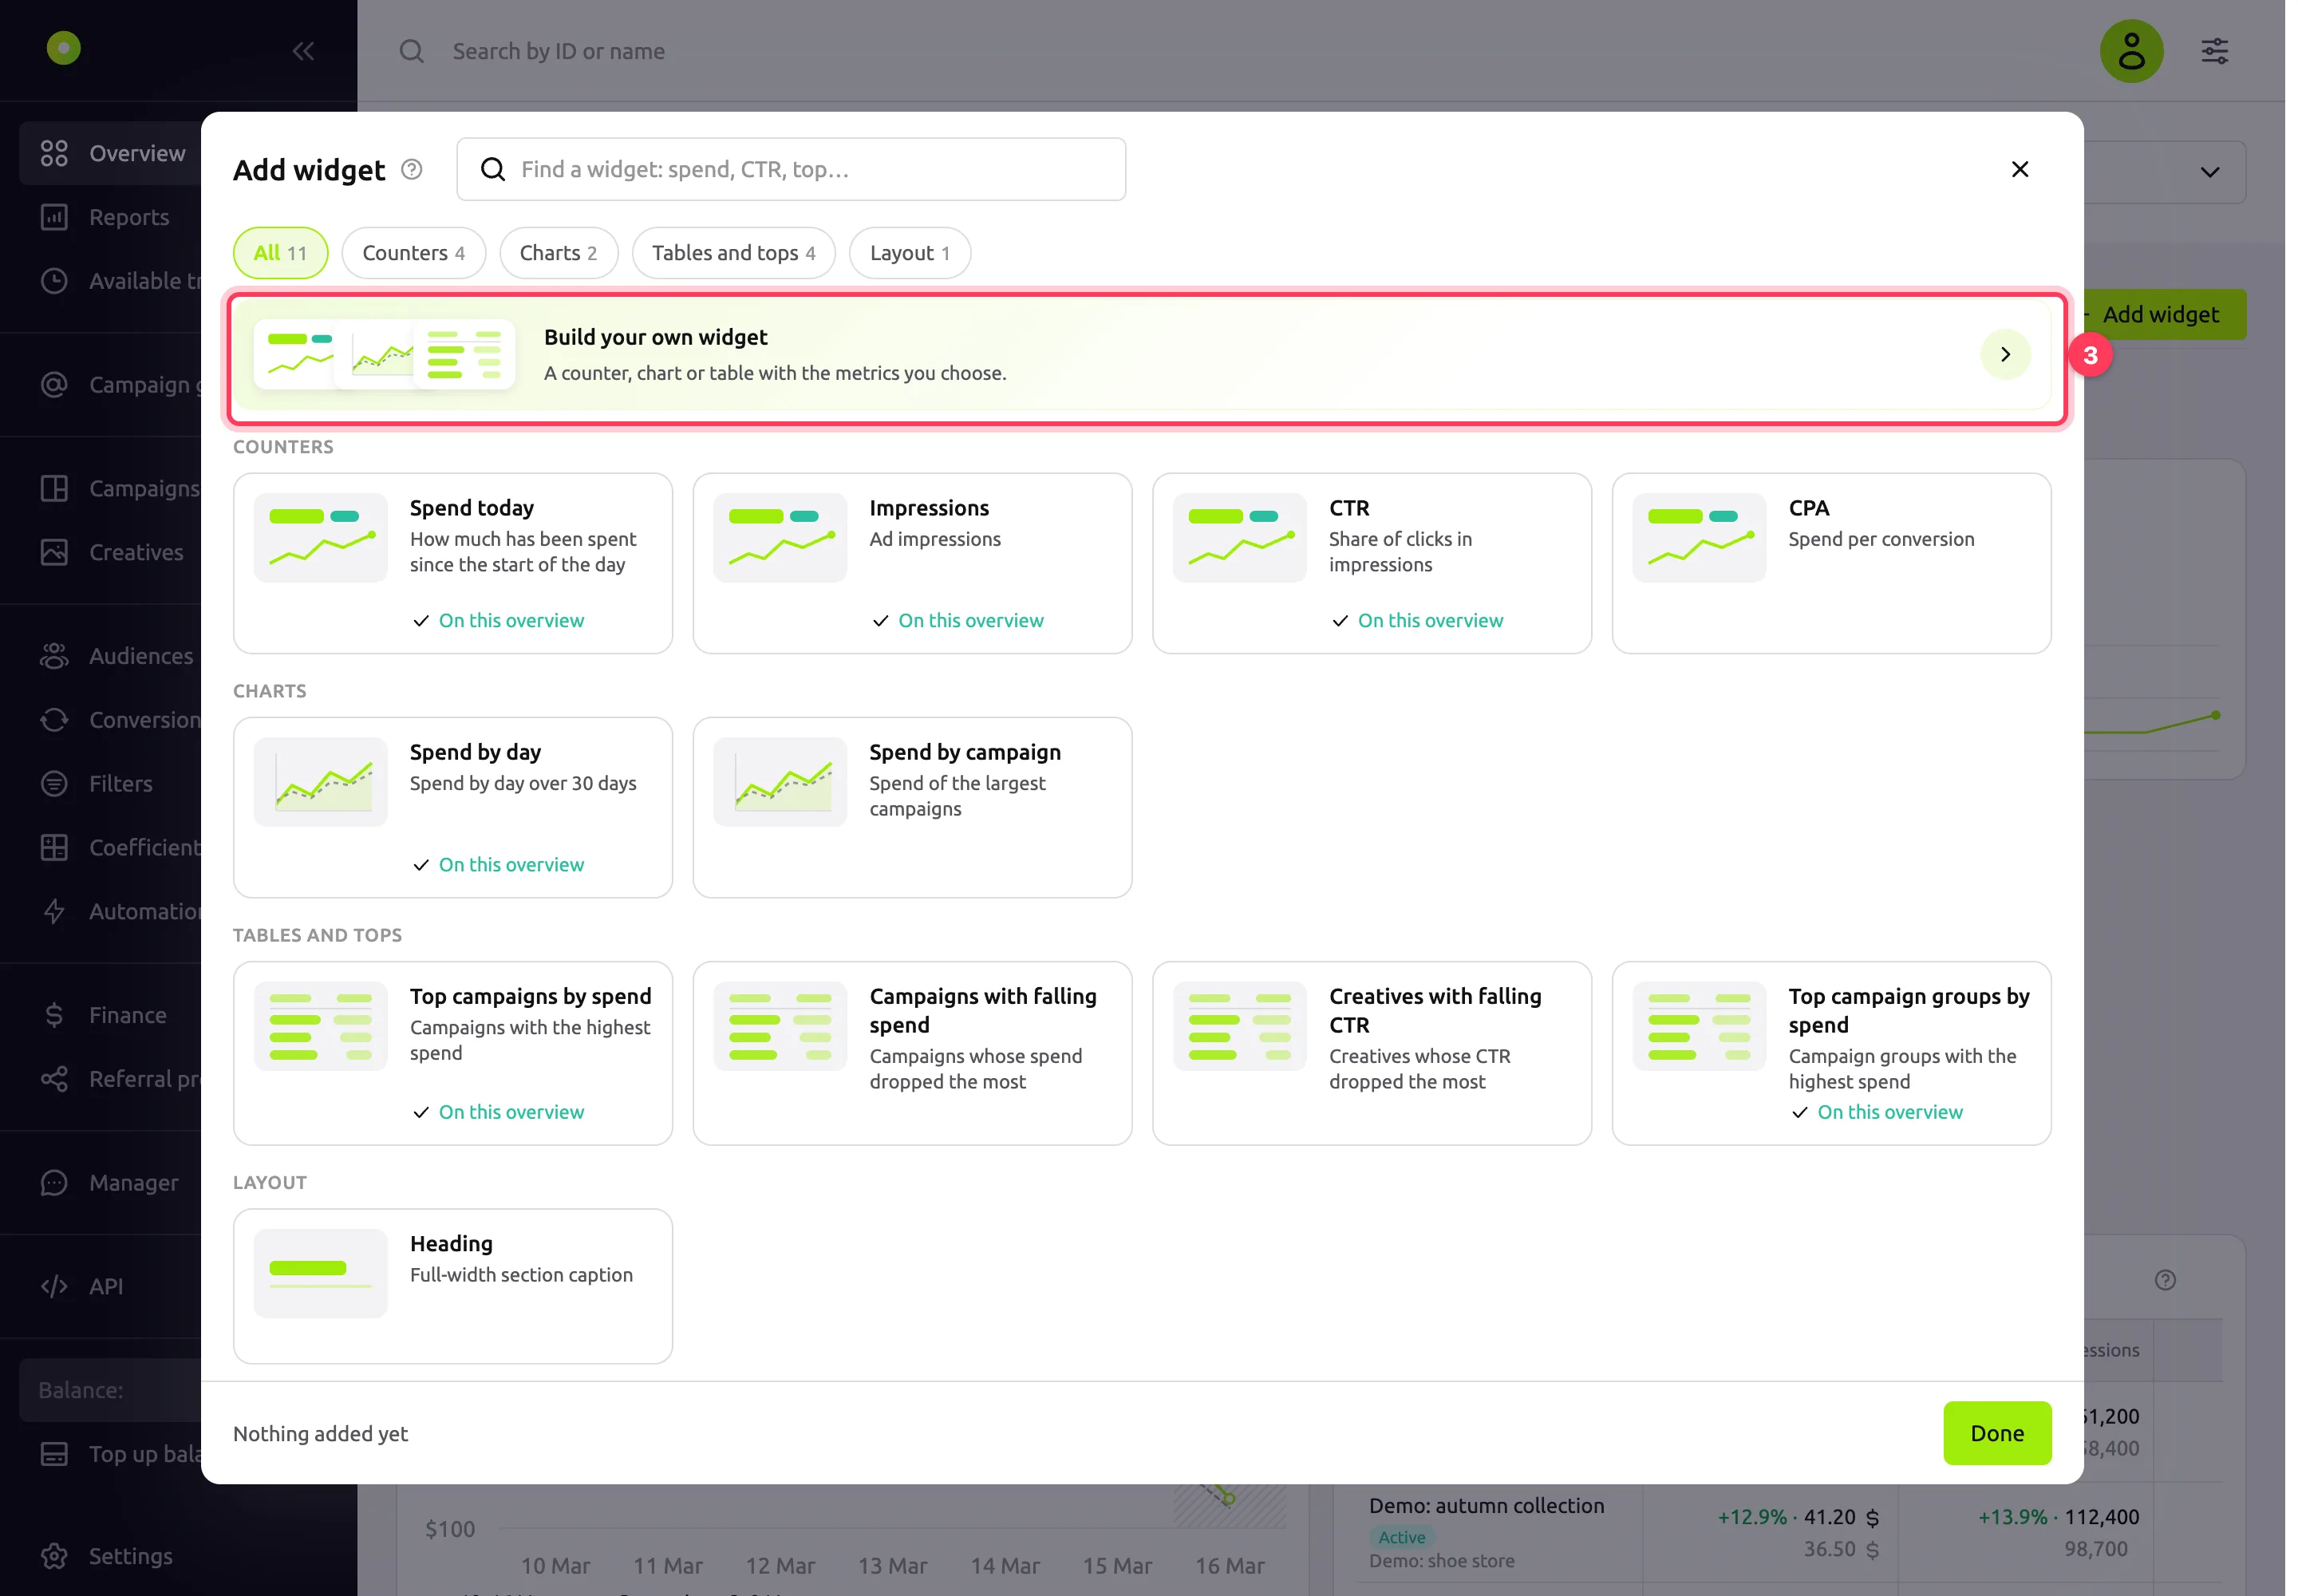
Click Add widget. Select a ready-made widget in the catalog or click Build your own widget. The catalog has the groups Counters, Charts, Tables and tops and Layout. Widgets that are already on the overview are marked On this overview.
Set up the widget in the Widget setup panel and check the result in the Preview. Click Add to overview: the widget is added to the end of the overview and saved immediately. When you have added everything you need, click Done.
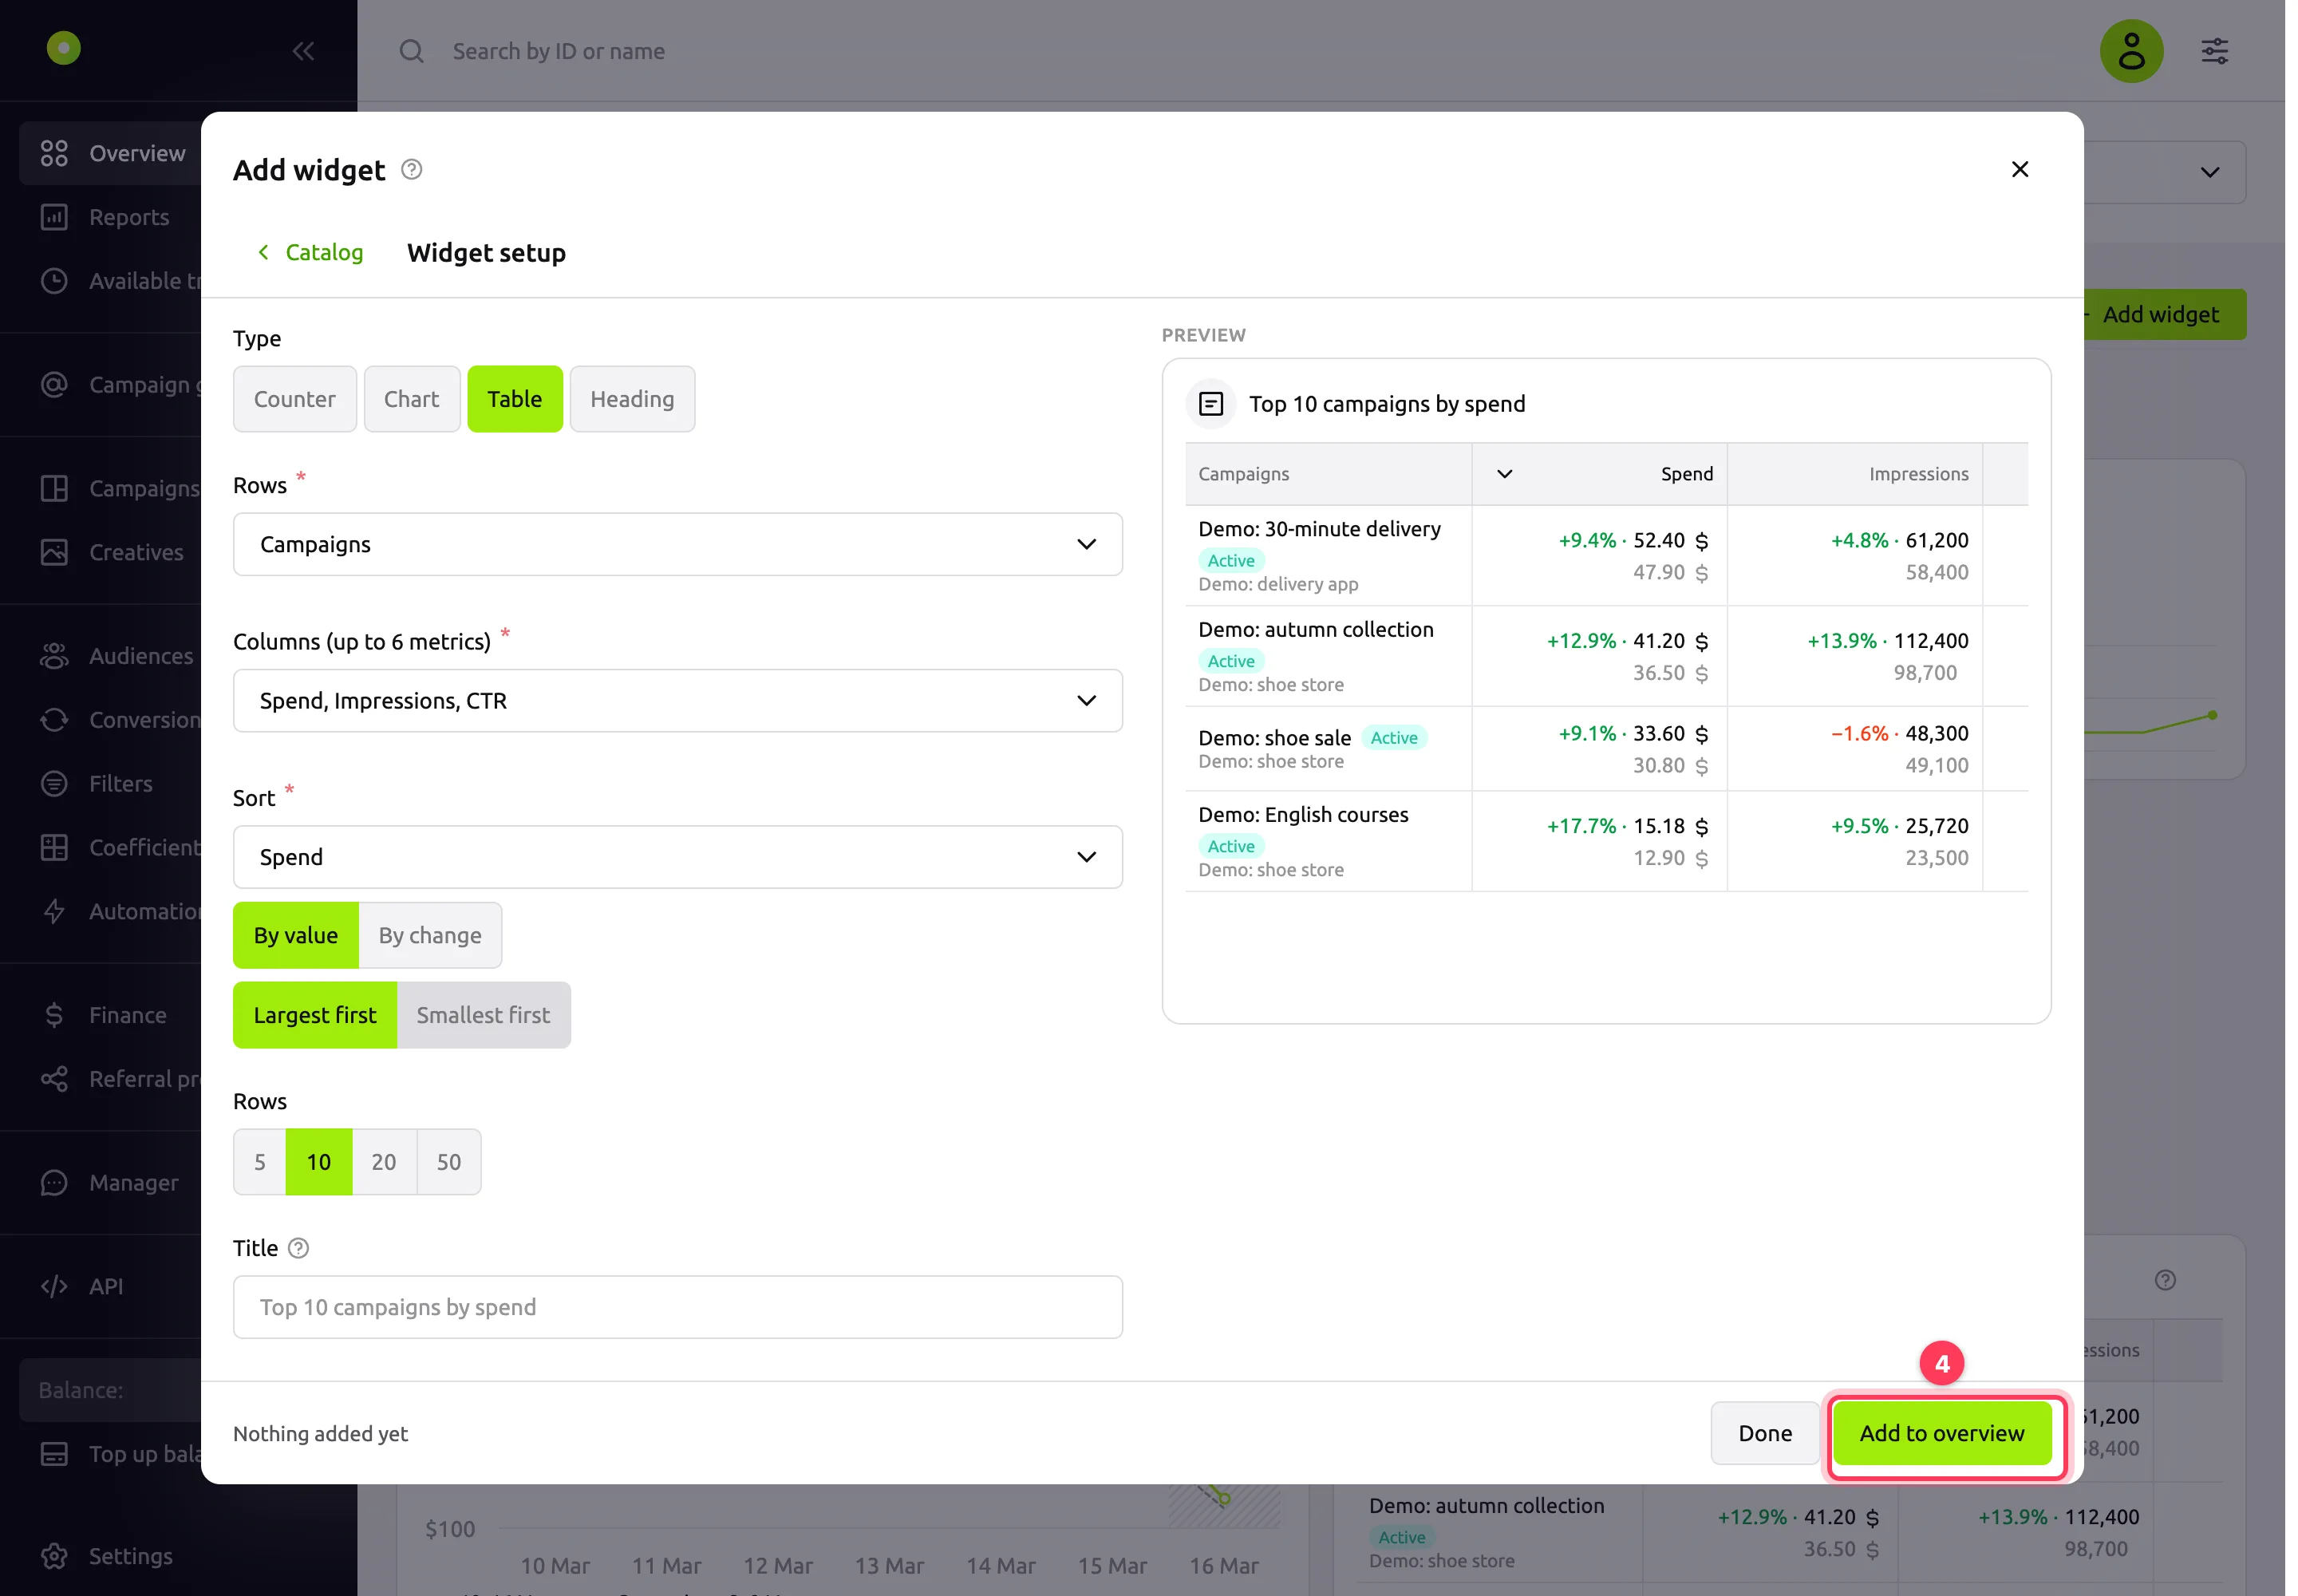
What you can set up:
- Type: Counter, Chart, Table or Heading, a full-width section caption.
- Metric for a counter or chart. Metrics and breakdowns are the same as in reports. See Reports.
- Break down by for a chart: a line for each campaign, campaign group, country and so on. The chart keeps the lines with the largest values.
- Rows, Columns and Sort for a table: the breakdown for rows, the metrics in columns and the sort order, By value or By change. The number of Rows is 5, 10, 20 or 50.
- Show: for a counter, the change against the comparison period and a mini trend chart; for a chart, the comparison period as a dashed line.
- Title. If you leave it blank, the title is generated from the settings.
- Period: Same as overview or its own.
- Filter by campaign groups or campaigns. The widget shows data for all selected values.
To change a widget, hover over it and click the Widget settings gear. Change the settings and click Apply.
To rearrange widgets, click Customize, the icon to the left of Add widget. Drag a widget by its handle and change its size with the resize handle. Each widget has the Settings, Copy and Remove buttons. When you finish, click Save to apply the changes, or Cancel. Until you save your changes, other tabs are unavailable.
To create another overview, click + overview to the right of the tabs. Enter the Name, select From cabinet template or Empty under Widgets, set the Time zone and click Create.
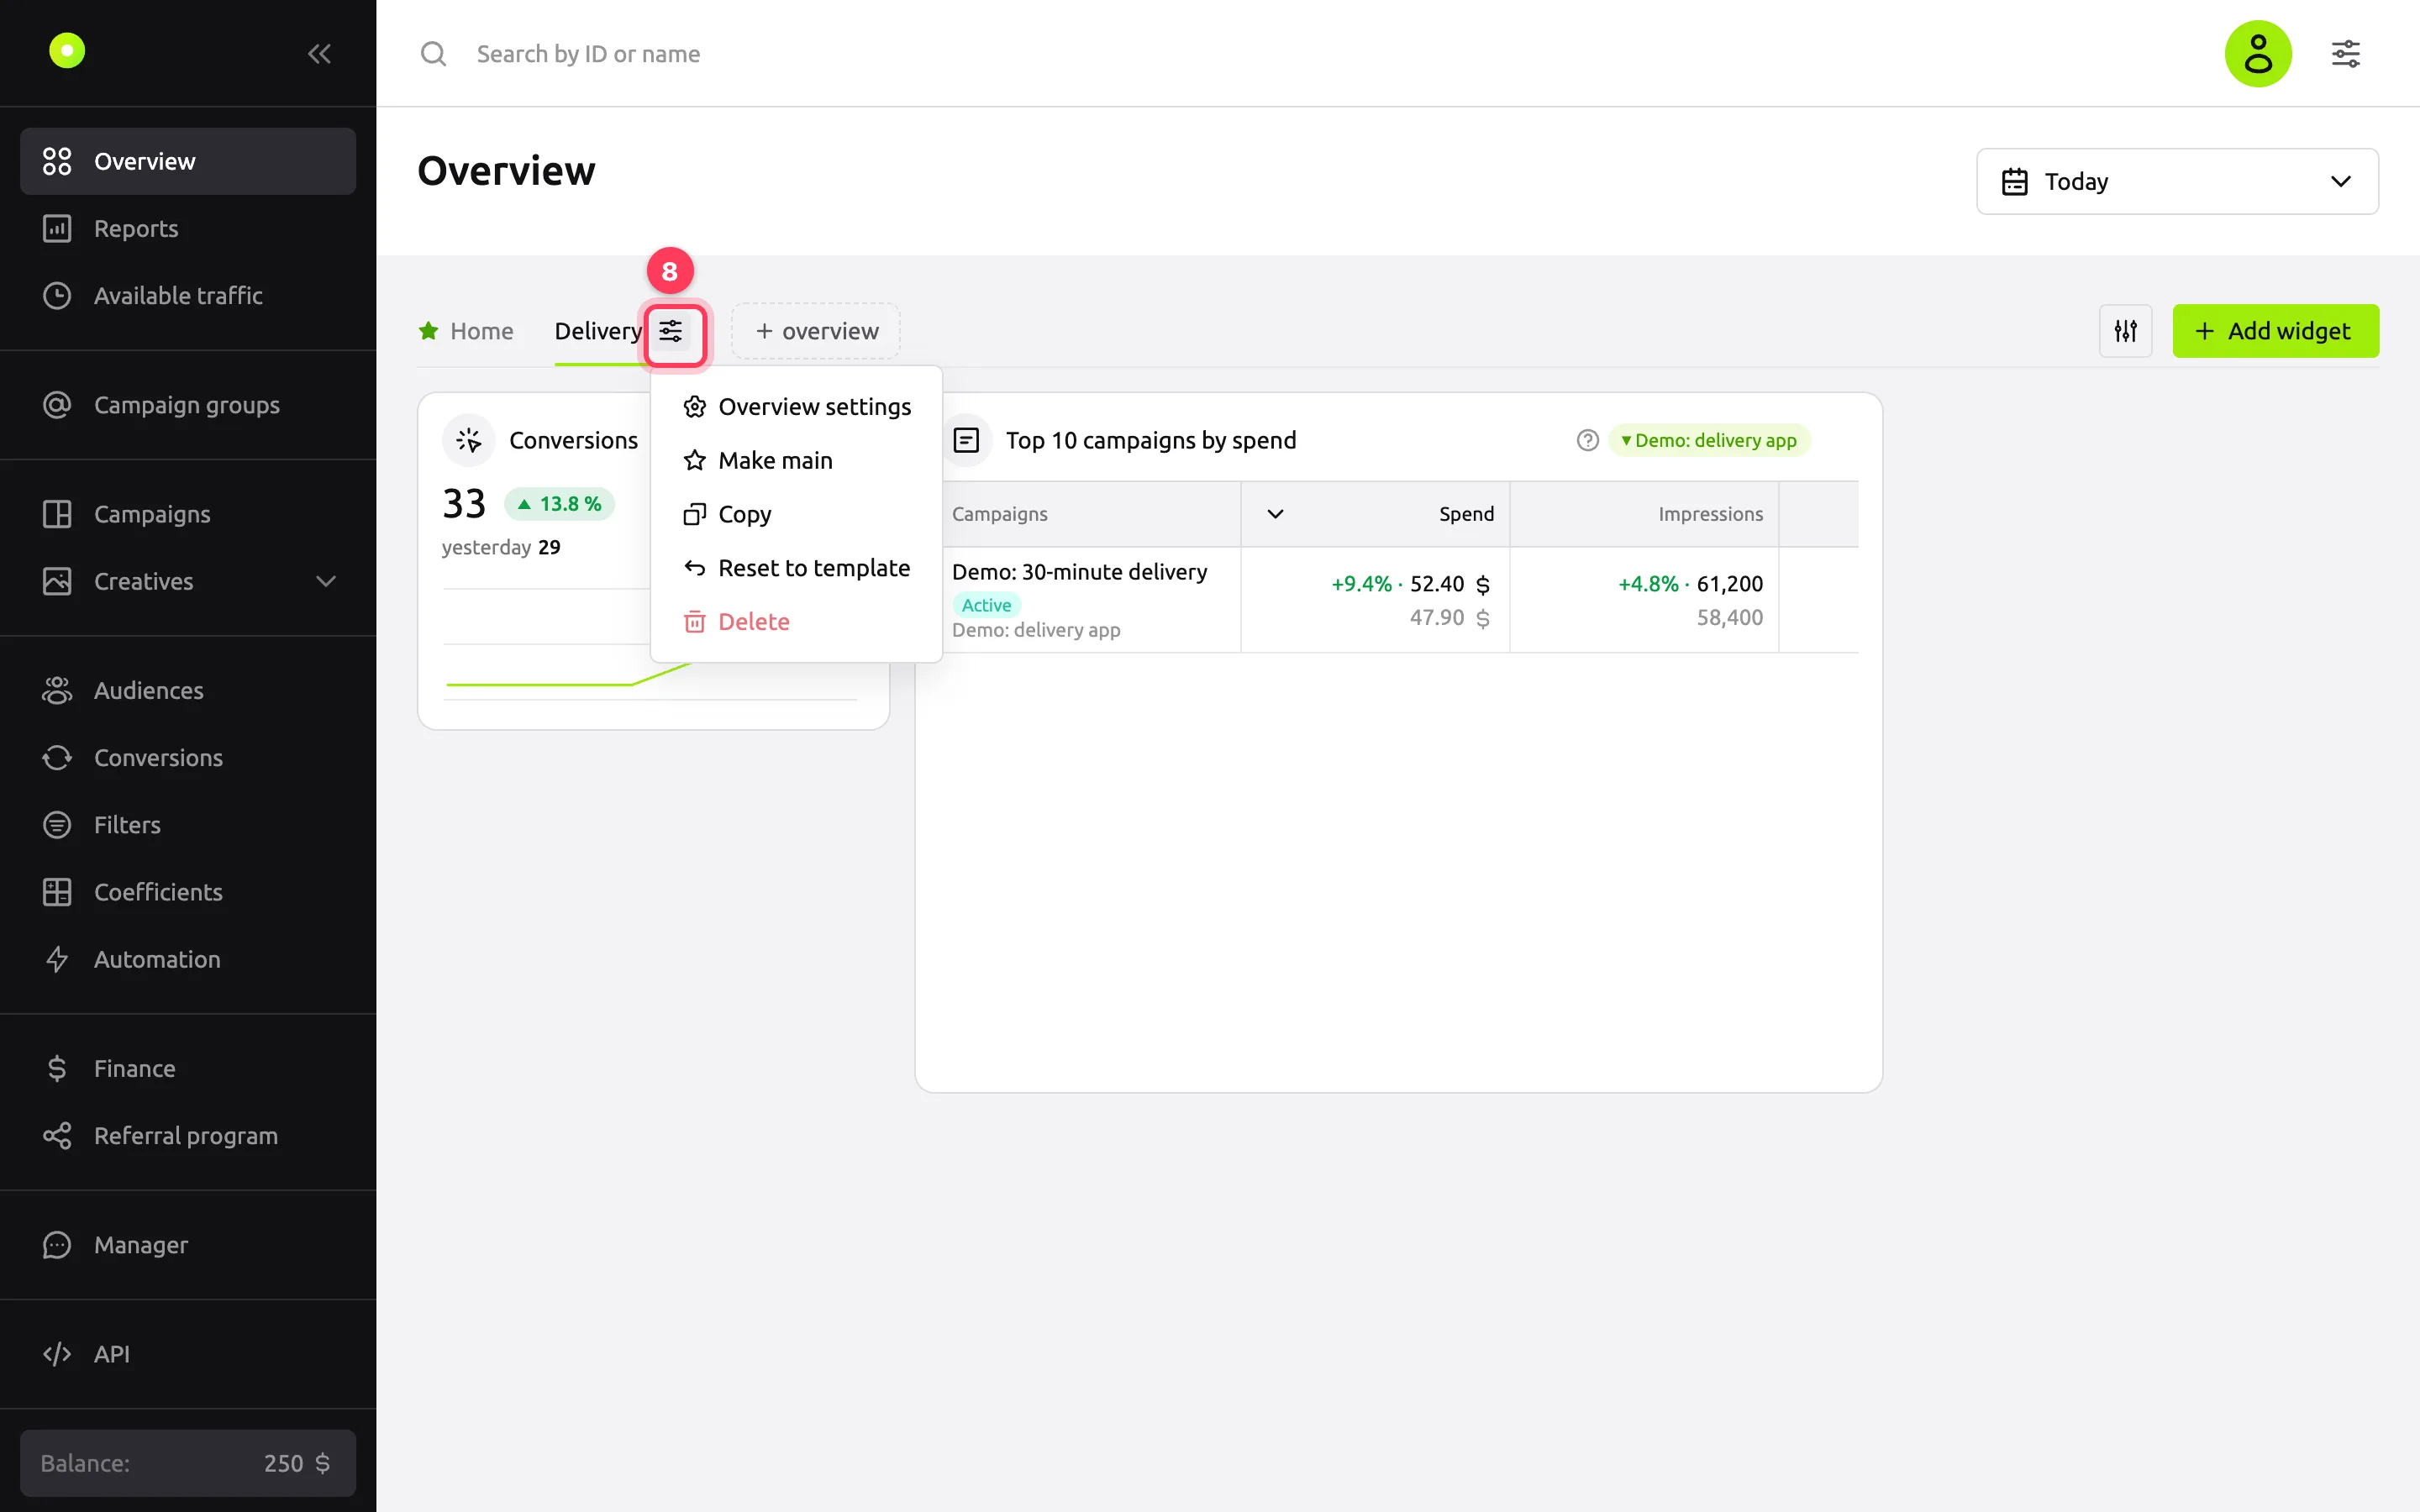
To manage an overview, open its tab and click the icon next to its name:
- Overview settings: the name and time zone.
- Make main: this overview opens first.
- Copy: a copy with all widgets appears to the right, and "(copy)" is added to its name.
- Reset to template: replace the widgets with the dashboard template set. The name, period and time zone stay the same.
- Delete: after confirmation. You cannot delete the last overview.
To change the order of tabs, drag them.
Result
The overview shows your widgets with data for the selected period:
- A counter shows the value, the change and a mini trend chart. The change is calculated against the same stretch of time before the period: for Today, against yesterday for the same hours. Shares (CTR, CR and so on) change in percentage points (pp), other metrics in percent.
- A chart plots points by hour, day or week; the step depends on the period length. The dashed line is the comparison period. A day that has not ended yet is labeled partial.
- A table shows the metric value, its change and the value for the comparison period. A campaign or group name links to its card. If you sort the table by a column, the sort is saved in the widget.
Statistics are calculated by full hours. Dates and hours are in the overview time zone from Overview settings; amounts are in the currency from the view settings. See Dashboard overview.
The number of widgets on one overview and the number of overviews are limited. When the number of overviews reaches the limit, the + overview button disappears and the Copy item becomes inactive.
Troubleshooting
| Symptom | Cause | Fix |
|---|---|---|
| "No statistics for the selected period" | The campaigns had no impressions during the period | Select a longer period |
| "Today's data will appear soon" | The first hour of the day has not ended yet, and statistics are calculated by full hours | Wait or select Yesterday |
| "No statistics for this filter" | The campaigns or groups in the widget filter have no data for the period | Select a longer period or change the Filter in the widget settings |
| "All rows are below the volume threshold" | There is too little data for the metric to be meaningful | Select a longer period |
| "Too much data" | A long period, a breakdown with many values or a wide filter | Shorten the period, remove the breakdown or narrow the filter |
| "No access" | The metric, breakdown or filter values are not available to you | Select other values in the widget settings |
| "No more room on this overview" | The overview has the maximum number of widgets; the window shows the number | Remove a widget you do not need in edit mode or click Create overview |
| "Custom period — up to 366 days" | The selected dates span more than 366 days | Shorten the period |
| "Cannot delete …" | This is the last overview | Create another overview first |
Next steps
- Build a report with nested groupings: when you need deeper statistics than the overview gives.
- Reports: metrics and groupings.
- Manage the campaign list.