
Reports
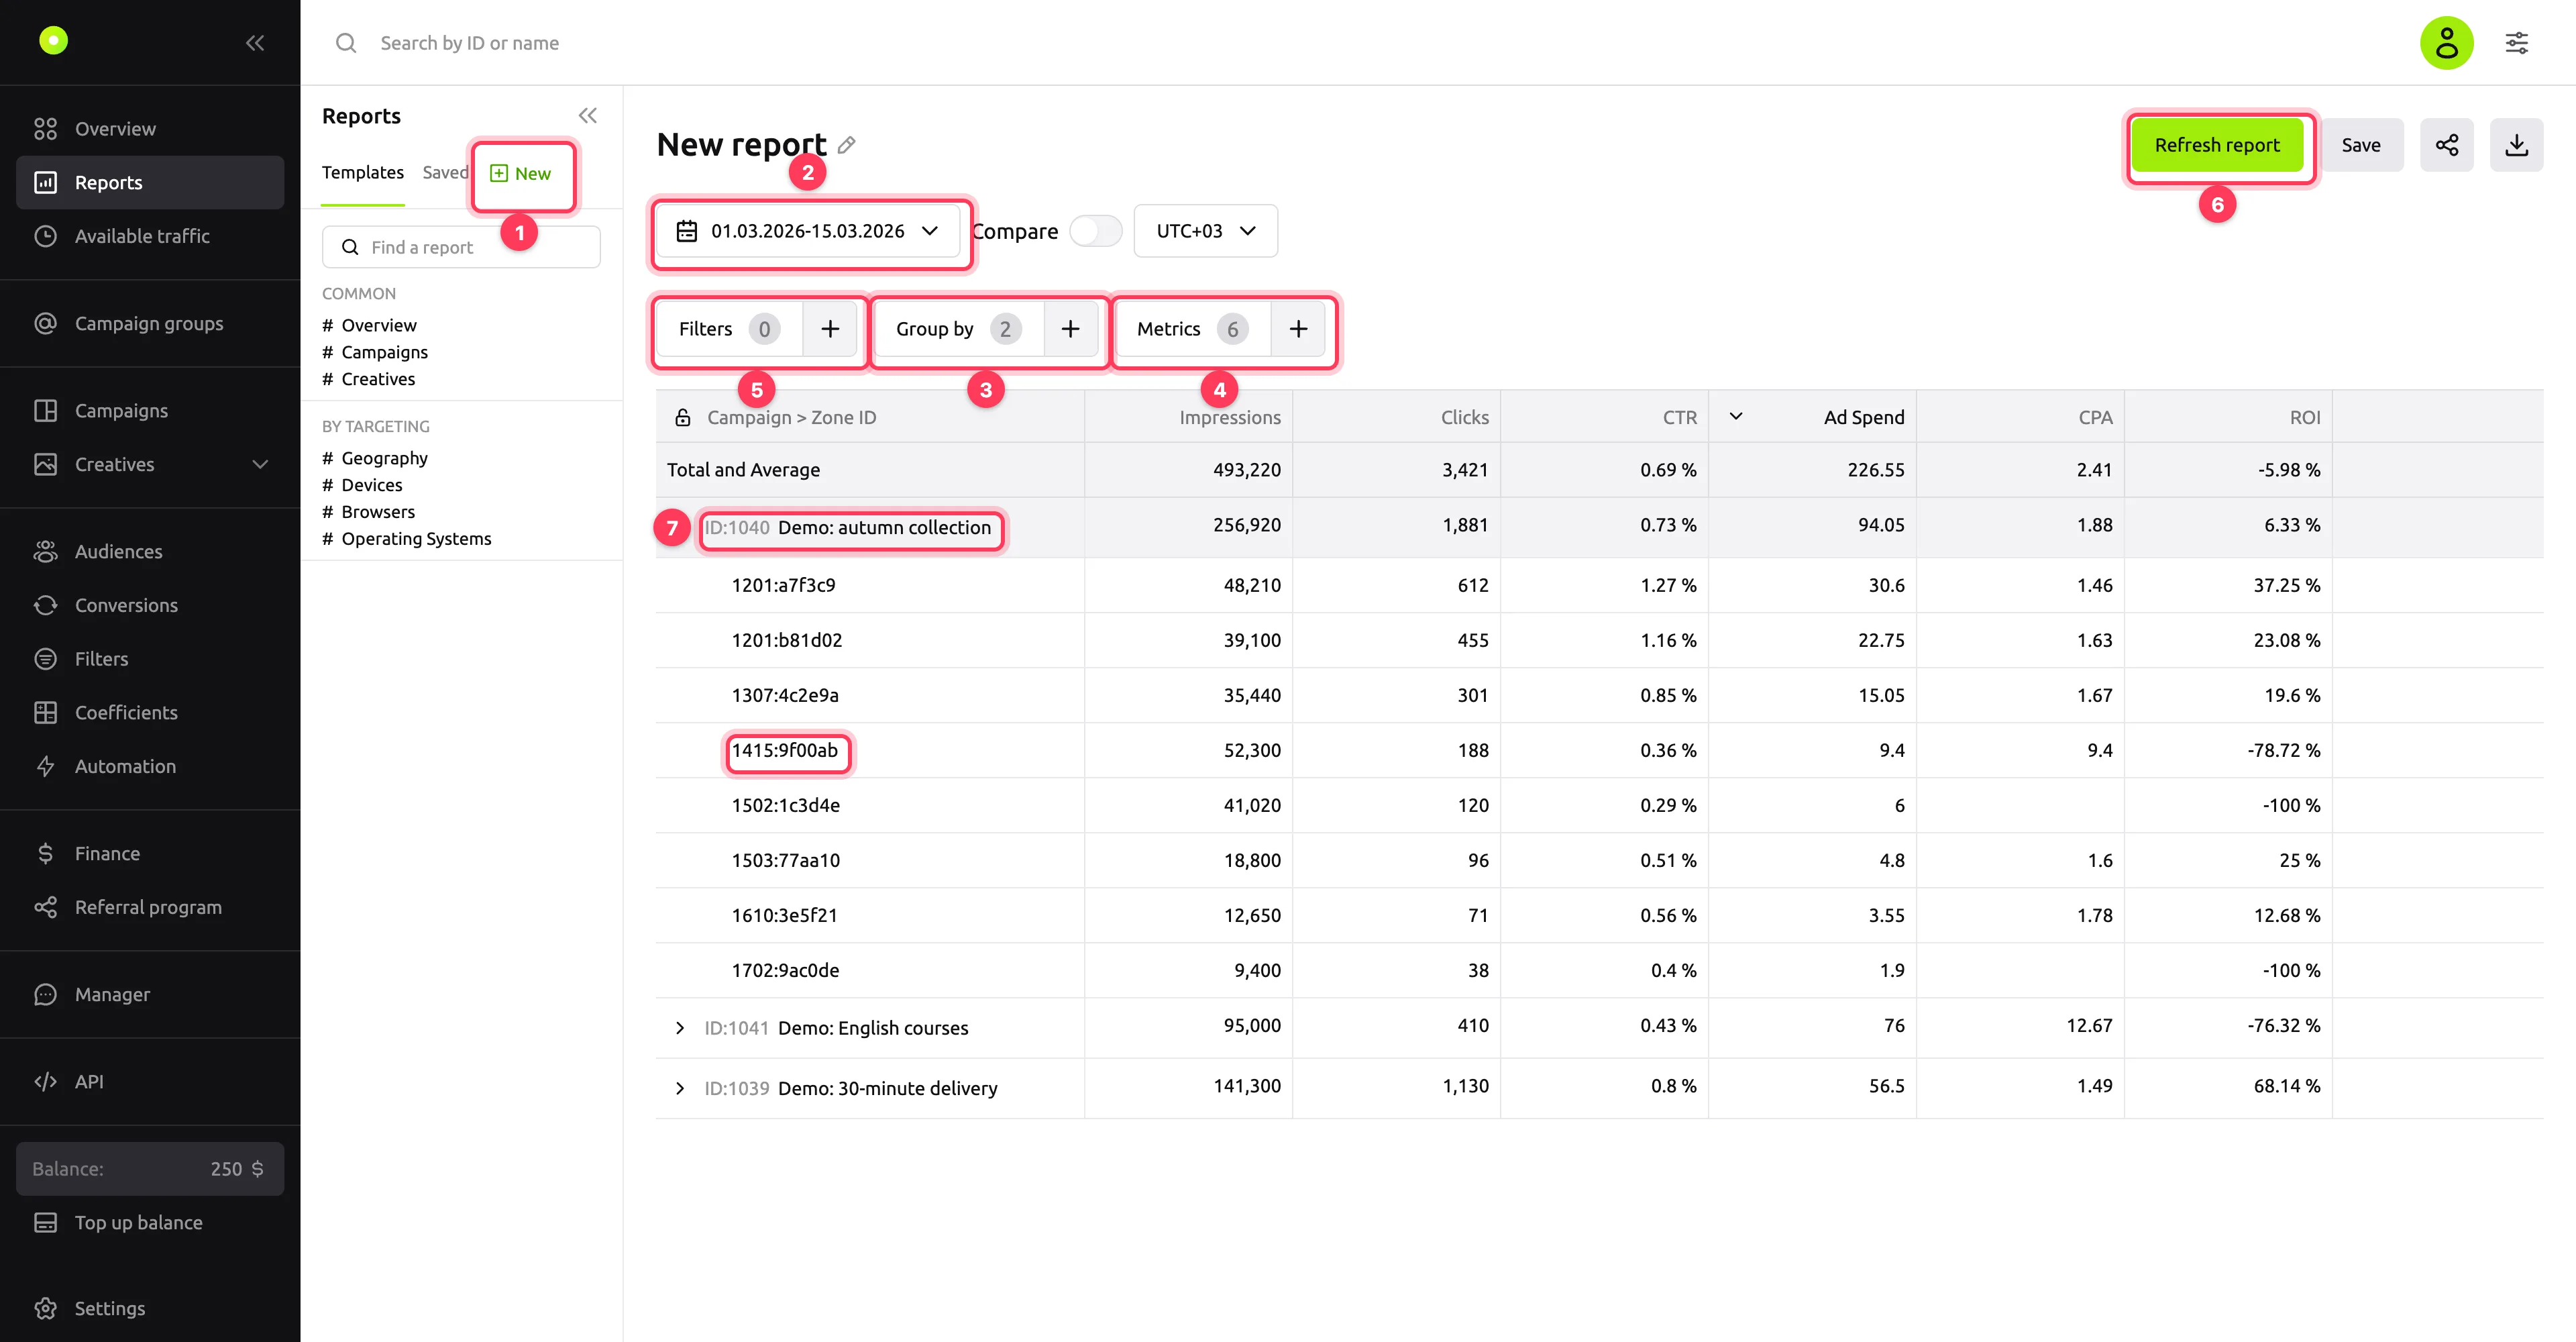
The Reports section builds statistics on your campaigns in any breakdown: by date, campaign, creative, zone, geo and device. Groupings nest inside each other, for example "campaign → Zone ID". For step-by-step instructions, see Build a report with nested groupings.
Metrics
Select metrics with the + button to the right of Metrics. In the window they are split into four groups, as in the tables below. Select all selects every metric except Reach, Viewable Reach and Unique clicks: select them manually.
General rules:
- Values are rounded to two decimal places. Percentages are shown with a % sign.
- If the denominator of a formula is zero, the cell is empty. For example, CPA is empty if there were no conversions, and CTR is empty if there were no impressions.
- In the Total and Average row, metrics are calculated from the totals for the whole report, not as an average of the rows. Reach in the total is unique users across the whole report, not the sum of the rows' reach.
- Amounts are in the currency selected in the View settings window (the icon in the top-right corner of the dashboard).
Quantitative
| Metric | What it counts |
|---|---|
| Bid Response | How many times the campaign placed a bid in an auction |
| Wins | How many auctions the campaign won |
| Impressions | Ad impressions. With pay per impression (CPMThe price per thousand impressions.), spend is charged for them |
| vImpressions | Impressions the user could see. The campaign's impression limit and frequency cap count exactly these. For details, see Auction and bid |
| Clicks | Clicks on the ad. With pay per click (CPCThe price per click.), spend is charged for them |
| Reach | How many different users received an impression. An approximate estimate |
| Viewable Reach | How many different users received a viewable impression. An approximate estimate |
| Unique clicks | How many different users clicked. An approximate estimate |
Qualitative
| Metric | Formula | Empty if |
|---|---|---|
| Win Rate | Wins / Bid Response × 100, % | There were no bids |
| Viewability | vImpressions / Impressions × 100, % | There were no impressions |
| CTRThe share of clicks in impressions, in percent. | Clicks / Impressions × 100, % | There were no impressions |
| vCTR | Clicks / vImpressions × 100, % | There were no viewable impressions |
Financial
| Metric | Formula | Empty if |
|---|---|---|
| Ad Spend | Total charges for impressions and clicks over the period | — |
| CPM | Ad Spend / Impressions × 1000 | There were no impressions |
| vCPMThe price per 1000 viewable impressions. | Ad Spend / vImpressions × 1000 | There were no viewable impressions |
| CPC | Ad Spend / Clicks | There were no clicks |
Conversions
Conversions get into the report only if a postbackA server notification about a conversion that a tracker sends to the platform. is set up or conversions are uploaded as a file. For details, see Set up postback and conversion tracking. Revenue in the formulas is the sum of the conversion values the tracker sent in the payout parameter.
| Metric | Formula | Empty if |
|---|---|---|
| Conversions | The number of conversions | — |
| CR | Conversions / Clicks × 100, % | There were no clicks |
| CPAThe cost of one conversion. | Ad Spend / Conversions | There were no conversions |
| ROI | (Revenue − Ad Spend) / Ad Spend × 100, % | There was no spend |
| eCPC | Revenue / Clicks | There were no clicks |
| eCPM | Revenue / vImpressions × 1000 | There were no viewable impressions |
NOTE
eCPM is calculated from viewable impressions, and CPM from all impressions. You cannot compare them directly.
If the tracker sends conversions with zero value, revenue is zero: ROI is −100%, eCPC and eCPM are 0.
If an agency gave you access to the dashboard, some metrics are empty. An agency client never sees Bid Response, Wins, Win Rate, Reach, Viewable Reach, Unique clicks and any metric of the Conversions group. The agency decides which of the other metrics the client sees.
Groupings
Select groupings with the + button to the right of Group by, up to 7 per report. To find a grouping, type its name in the search field at the top of the window. The order in the list of selected groupings is the nesting order of the rows. If a grouping value is not defined, the row says "No data".
| Section | Grouping | What the row shows |
|---|---|---|
| Date | By hour, By day, By week, By month | The hour, day, week or month in the report time zone. For weeks, the period must start on a Monday; for months, on the 1st |
| Geography | Country, Region, City | Where the user was |
| Objects | Campaign group | The campaign groupA folder for one advertiser's campaigns with shared settings and limits. |
| Objects | Campaign | Campaign ID and name |
| Objects | Creative | Creative ID and name |
| Inventory | Zone ID | The zoneA specific ad slot on a site or in an app, for example a block on a site page.: the ad slot on the placement, for example 1201:a7f3c9. The {zone_id} macro passes the same value, and filters and selective coefficients accept it |
| Inventory | Bundle ID | The ID of the app where the impression happened |
| Inventory | Language | The language of the placement page, or, if it is unknown, the language of the user's browser or device |
| Targeting | Device, Operating System, Browser, Connection type | Data about the user's device |
| Targeting | Days Since Subscription | For Push: how many days ago the user subscribed to notifications |
Templates
Templates are ready-made reports on the Templates tab of the Reports section. Each template has one grouping and every metric except reach and unique clicks. When you select a template, filters are reset, and the period and time zone return to their defaults. Rows are sorted by vImpressions from highest to lowest, and in Overview by date from newest to oldest.
| Section | Template | Grouping |
|---|---|---|
| Common | Overview | By day |
| Common | Campaigns | Campaign |
| Common | Creatives | Creative |
| By targeting | Geography | Country |
| By targeting | Devices | Device |
| By targeting | Browsers | Browser |
| By targeting | Operating Systems | Operating System |
To load the template data, click Refresh report. To keep a changed template, click Save → Save as new: the report appears on the Saved tab, and the original template stays the same.
Filters
Select filters with the + button to the right of Filters. Inside a filter there is a search, Show chosen only and selection of all values. Reset filters removes all filters at once.
| Section | Filter | How to set it |
|---|---|---|
| Objects | Creative, Campaign, Campaign group | Select values in the list |
| Inventory | Zone ID | Enter a zone ID and press Enter. Separate several IDs with commas. Write the full ID, as in the report: 1201:a7f3c9. A value in any other form is ignored, and the report may come out empty |
| Inventory | Language | Select values in the list |
| Geography | Country, Region, City | Select values in the list |
| Targetings | Device, Operating System, Browser, Connection type | Select values in the list |
| Conversions | Conversion class: Micro, Qualified, Revenue | Select classes. Each conversion type has a class |
| Conversions | Conversion type | Select types, for example Purchase |
Filters in the Conversions section narrow only the conversion metrics: Conversions, CR, CPA, ROI, eCPC, eCPM. Impressions, clicks and spend in the row are not filtered.
Period, time zone and currency
- Period: select it in the calendar or with the Today, Yesterday, This week, Last 7 days, Current month, Previous month, Last 30 days buttons. By default, it is the last month up to today. The longest period is 183 days.
- Time zone: from UTC−12 to UTC+12. By default it comes from the View settings window, where it is initially UTC+03. A time zone selected in a report applies only to that report and is saved with it. The time zone defines day boundaries and the hours in the By hour grouping.
- Currency: you cannot select it in the report; it comes from the View settings window. Amounts in another currency are converted at the exchange rate on the date of each event.
Daily and hourly campaign limits are counted in UTC, so a "day" in a report with the UTC+03 time zone and a day in a limit do not match. For details, see Spend is not what you expected.